Analytical Components
Every business needs to process and organize data on a regular basis. Also, your daily activities can become tedious when you have to get regular updates on trends, targets, performance indicators, pipeline stages, meetings, follow-up calls and more. Dashboards use analytical insights and give you detailed overview of all the important data at a glance.
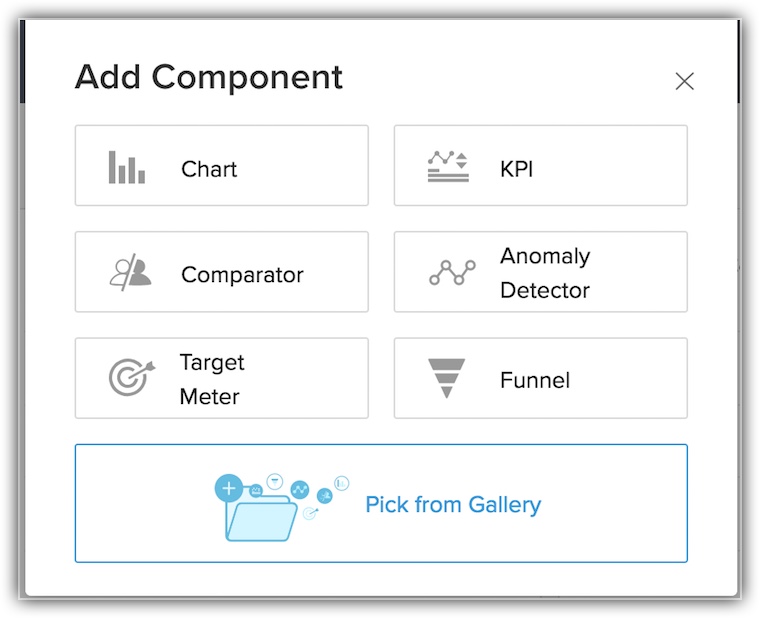
Analytical components display your organization's data in a pictorial form making it more comprehensible. Zoho CRM provides six different types of analytical components for your dashboards. Below are the list of components you can choose from:
- Chart - Chart is a graphical representation of your data. It gives a quick insight of the records for an easy analysis.
- KPI - Key Performance Indicator lets you measure the performance of your team.
- Comparator - Comparator gives you a comparative overview of any data like user performance, lead source etc.
- Anomaly Detector - Anomaly Detector detects any type of discrepancy in your usual business process.
- Target Meter - Target meter lets you set and monitor targets for your team.
- Funnel - Funnel provides you a visual depiction of different stages in your business.
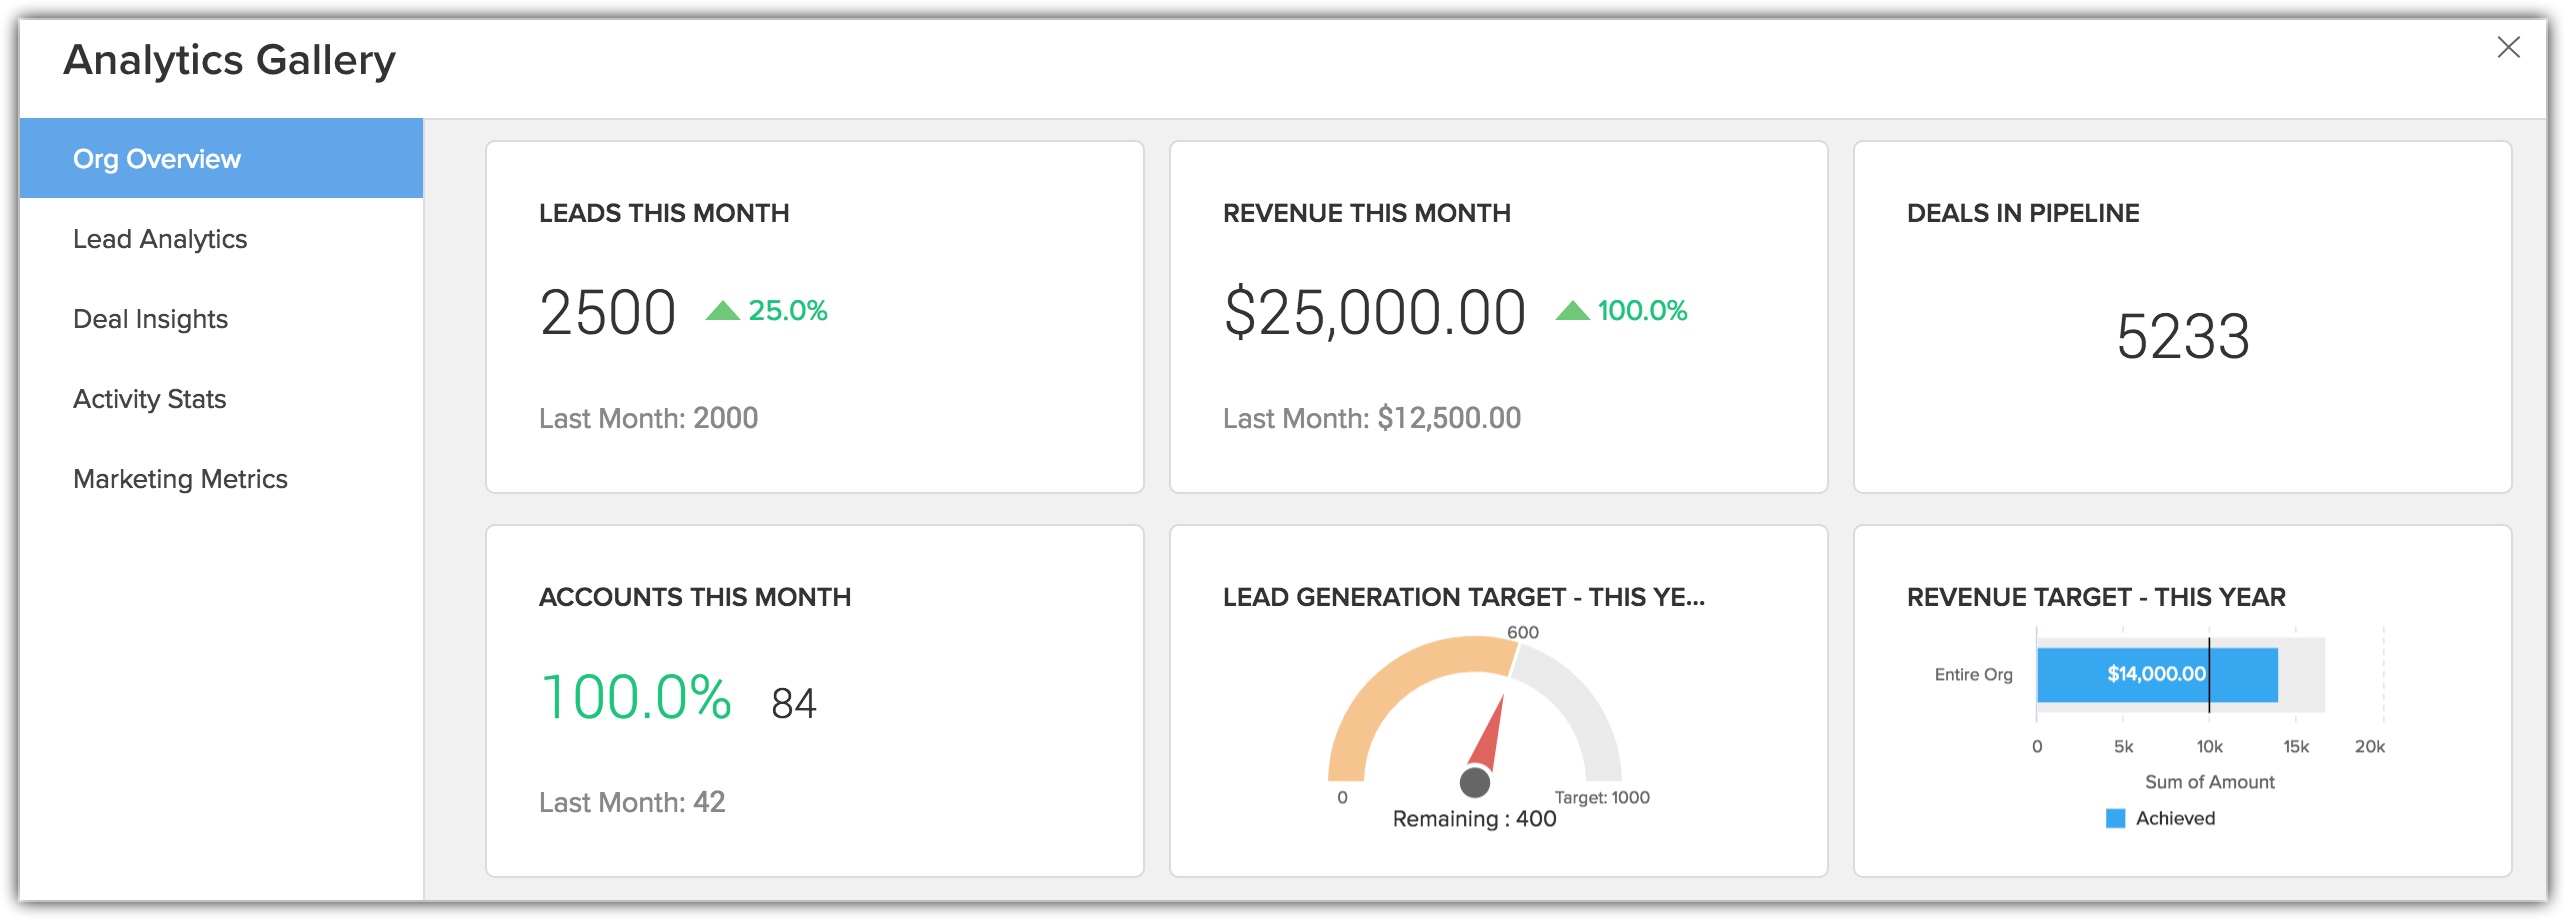
You can also choose to add components from the Analytics Gallery page. All you need to do is, click the Pick From Gallery option in Add component and select a component from the gallery.

Note
- You can add maximum 10 components to a dashboard.
- Only Summary and Matrix reports can be added to the dashboard.
- You can delete only those custom charts that are created by you.
- Before you begin working with the dashboards make sure you install and enable the Adobe Flash plug-in in your browser
- Standard and Professional edition users can only create Charts and KPIs.
- You can view a detailed drilled-down report by clicking on Charts, KPIs, Target meters and Comparators.
- You can clone a component, when you want to create a component that is similar to an existing one. You can click on the More icon of an existing component and click the Clone option.
Related Articles
Adding Components for Dashboard
Add Components After creating a dashboard you must add components (representing the exact data in pictorial form), which includes Bar, Pie, Line, Funnel, or Table charts. You can select the charts to display the data in a pictorial form and also ...Working with Dashboards
Dashboards are used to monitor business performance and the reports are shown to provide a quick and easy overview of how your business is performing with the help of charts, KPIs. You can create a dashboard and share it with all the users or few ...Zoho CRM Plus - Getting started guide for Sales teams
Every business goes through a sales cycle, from acquiring, nurturing, and following up on prospects to closing business deals with them. There may be many activities involved in each phase, such as scheduling appointments with your customers, ...Can Zoho Analytics be used as an Online Database?
Zoho Analytics is an Online Reporting and Business Intelligence service. The features offered by Zoho Analytics specializes on providing in-depth, powerful and flexible reporting and analytical capabilities. It contains an in-built database grid ...What is the difference between Zoho Analytics and Zoho Creator?
The key difference between Zoho Analytics and Zoho Creator is in-depth reporting and analytics vs online custom database application creation. Zoho Analytics enables you to easily create powerful and sophisticated reports with your data by creating ...