Creating Dashboards

Profile Permission Required: Access to the Dashboards Tab and Manage Reports And Dashboards permission.
List of Standard Dashboard Components
In the Dashboard home page the following types of dashboards are available:
| Module | Standard Dashboard Components |
| Candidates |
|
| Clients and Contacts |
|
| Job Openings |
|
| Territory |
|

- You cannot modify or delete the standard dashboards.
- On sharing a dashboard that you have created with other users in your organization, note all information in the dashboard will be visible to them, even though some users may not have the permission to view some fields.
- Click the Dashboards tab.
- In the Dashboards Home page, click the Add link.
- In the New Dashboard page, do the following:
- Enter the Dashboard Name.
- Select the users with whom you want to share the dashboard.
- Only me - Accessible only to you
- Everyone - Shared to all users of your ATS.
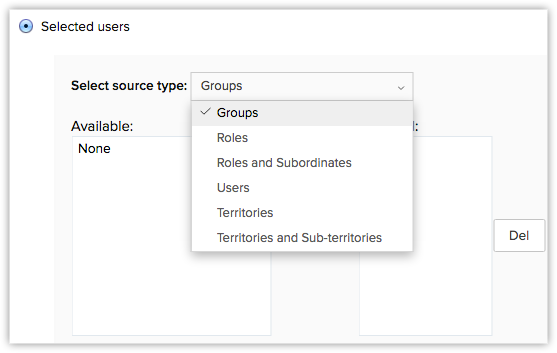
- Selected Users - Shared only to a selected list of users.

Under selected users, you can select one of the following sources - Groups, Roles, Roles and Subordinates, Users, Territories, Territories and Sub-territories.
- Only me - Accessible only to you
- Enter the Dashboard Name.
- Click Save.
Add Components
After creating a dashboard you must add components (representing the exact data in pictorial form), which includes Bar, Pie, Line, Donut, Area, Funnel, or Table charts. You can select the charts to display the data in a pictorial form and also a table to display the data in tabular format.
Note
- You cannot modify or delete the standard dashboards.
- On sharing a dashboard that you have created with other users in your organization, note all information in the dashboard will be visible to them, even though some users may not have the permission to view some fields.
List of Standard Charts
| Chart Type | Description |
| Bar chart | To display two or more kinds of data, that can be used to compare values across categories. |
| Pie Chart | To display data that is divided into triangular areas proportional to the percentages of the whole and used to illustrate the relationship of parts to the whole. |
| Line Chart | To display a trend over a period with the variations in the multiple values in a single chart. |
| Funnel Chart | To show the convergence of data from the entry level to exit level. It is typically used to show the recruitment pipeline at any point in time. |
| Table Chart | To show the sum of the values in each category of the data. |
To create report charts:
- Click the Dashboards tab.
- In the Dashboards Home page, select the dashboard in which the component has to be added.
- In the Dashboards page, click Add Component.
- In the Add Component page, choose one of the following:
- Get From Report - This will get the data from a report in your Recruit account.
- Get From Gallery - Select a dashboard from a list of predefined dashboards.

- Get From Report - This will get the data from a report in your Recruit account.
- Select the desired report/dashboard from the gallery.

- In the resulting page, do the following:
- In the Component Name text box, enter the name for the component.
- Select the type of chat from the Select a chart type list box.
- Under Provide Chart Details part, select the X and Y axis components.

- Click Done.
After adding a chart to the dashboard, you can perform the following operations:
- Add to favorites
- Delete the chart
- Edit the chart
- Add to Home
- Drill-down the chart
- Change to 2-dimensional or 3-dimensional view
- Embed URL
Note
- You can delete only the custom charts created by you.
Drill Down Dashboards
This feature enables you to view a detailed report on the selected data in any dashboard report.
To drill-down dashboards
- Click the Dashboards tab.
- In the Dashboards Home page, select the required dashboard.
- In the selected dashboard, click on the data for which you need a detailed report.
- The data is displayed in the form of a report.
- In the Report page, you can export the data to PDF/XLS/CSV, save the report, customize it, or create a chart based on the details.
Add to Home
This feature allows you to add the chart to the home page of your Zoho Recruit.
To add the chart to your home page
- Click the Dashboards tab.
- In the Dashboards Home page, select the required dashboard.
- In the selected dashboard, click
 [more options icon] in the chart that has to be added to your home screen and click Add to Home.
 - Now the chart will be added to your home page.
Add to Favorites
You can mark the most important charts as your favorites. These charts will be displayed separately in the favorites page and are easy to view.
To add the chart to your favorites page
- Click the Dashboards tab.
- In the Dashboards Home page, select the required dashboard.
- In the selected dashboard, click
 [Favorite icon] corresponding to the chart that has to be marked as favorite.
 - Now the selected component will be displayed in Favorites page.
Embed URL
You can embed the chart in any web page if requires. This can be done by copying the URL from Zoho Recruit and pasting it in the required site.
To embed the chart's URL
- Click the Dashboards tab.
- In the Dashboards Home page, select the required dashboard.
- In the selected dashboard, click [more options icon] in the chart that has to be added to your home screen and click Embed URL.
- From the Embed URL page, copy the URL from the copy URL text box.
- Enter the domains in which the chart should be displayed in the Enter allowed domains text box.
This chart will be visible only in the domains that are entered here. For example, if you copy paste the chart in a page with the domain .edu but this domain isn't specified in this text box, then the chart cannot be viewed in that webpage.
- Click Finish.
Related Articles
Creating Dashboards
Dashboard is a summarized view of the custom report data in Zoho CRM. It provides a platform for a real-time analysis of the sales stages and business operations. You can create a dashboard and share it with all the users or few selected users. You ...Custom Dashboards
Creating a new Dashboard You can create customized dashboards to collate and analyze data across social channels. You will be able to add the different Cards available for each network in your Custom Dashboard as per your requirements. Adding Cards ...Working with Dashboards
Dashboards are used to monitor business performance and the reports are shown to provide a quick and easy overview of how your business is performing with the help of charts, KPIs. You can create a dashboard and share it with all the users or few ...Manage Dashboards
Dashboards provide a unified view of selected KPIs, targets, and contests, plus real-time indicators to highlight areas of interest. Various types of tiles can be placed in a dashboard. Types of tiles KPI (Key Performance Indicator) KPIs are ...Dashboards - An Introduction
Dashboards in Zoho Motivator provide an overview of your sales activities to help you track and improve your sales performance. Dashboards provide a unified view of selected KPIs (Key Performance Indicators), targets, and contests, with real-time ...