Gantt charts

- Editable Global Gantt charts: Enterprise plan
- Editable Project Gantt charts: Premium plan
- View Project Gantt charts: All plans
Gantt Chart
A Gantt chart is a visual representation of the project schedule. It displays information about task progress, task owner, task status and other task related data. In Zoho Projects, you can view the Gantt chart in two different views:
- Milestone Gantt: Milestones, Task Lists, and Tasks are displayed based on their hierarchy in the project. Milestones are represented as a red rhombus; Task lists as black horizontal bars; and Tasks in various colors as horizontal Gantt bars.
- Chronology Gantt: Gantt bars are displayed based on the order of the start date in the project. Tasks and Subtasks are represented in various colors as horizontal Gantt bars.
You can edit all your Gantt charts by resizing and dragging the task bar. When you edit the parent tasks the related dates of child tasks will also be updated.
Chronology Gantt Chart
What can you do with the Chronology Gantt?
The Chronology Gantt gives a visual perspective to the Tasks module. You get to see the task details, their schedule, assignees, dependencies, literally everything related to tasks in one frame.
- The horizontal bars represent the task schedule and you can drag and place the bar anywhere in the timeline to reschedule.
- Hover over any shaded part in the bar to get an overview about the task.
- Click the Show Legends link to learn more about the colour codes used in this Gantt.
- Like how you reschedule the tasks, you can as well change their dependencies. Know more about setting dependency using Chronology Gantt.
Access Chronology Gantt Within a Project
- Click Projects in the top band and navigate to your project.
- Click Reports & Charts in the left panel.
- Click the Gantt Chart section in the main panel to view the Gantt for the tasks and subtasks.
- Click Projects in the top band and navigate to your project.
- Click Reports & Charts in the left panel.
- Click the Gantt Chart section in the main panel.
- Click
 in the upper-right corner. Click Convert to PDF and you will see the following options:
- Fit to Width: Adjusts the data in the chart to the width of the page.
- Chart in View: The data in the chart is replicated as seen on screen.
- Show Task Owner: Shows or hides the task owner(s) names displayed near the task bar.
- Show Dates: Shows or hides the dates displayed near the task bar.
- Fit to Width: Adjusts the data in the chart to the width of the page.
The Bring bar into view option brings the Gantt bar for the selected task into the Gantt chart view. Click ![]() to remove the predecessor tasks right within the Gantt chart itself. These options are available in both the Milestone Gantt and Chronology Gantt.
to remove the predecessor tasks right within the Gantt chart itself. These options are available in both the Milestone Gantt and Chronology Gantt.
The Chronology Gantt is available in all the plans.
Milestone Gantt
In the Milestone Gantt view, you can view the milestones, task lists, and tasks on the left and the corresponding bars on the right that show the actual schedule. You can filter the tasks based on Project, Milestone, Milestone Status, Milestone Owner, Task Status, and Task Owner. You can also save the filter settings of the chart so that after you navigate to another view, you can get back to the chart view of previously saved filter at a later point of time.
The Milestone Gantt is available in our Express, Premium, and Enterprise plans.
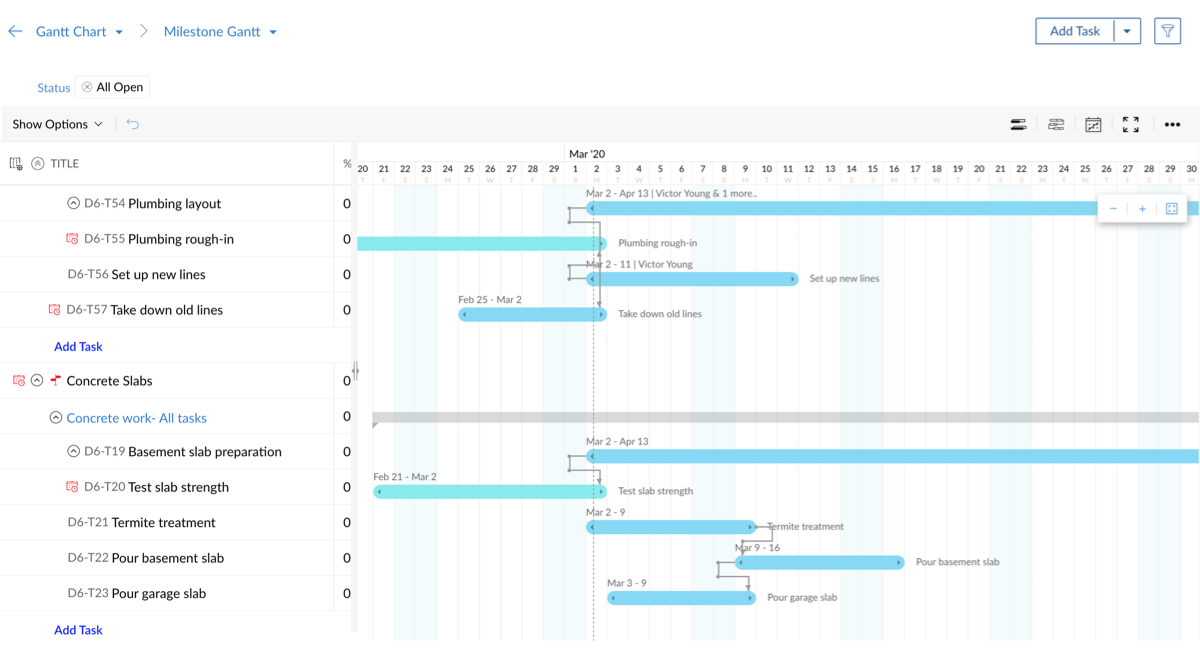
What can you do with the Milestone Gantt?
- Edit any task within the Milestone Gantt itself.
- In the left-bottom of the Gantt chart, scroll right to view other task details like Completed Percentage, Duration, Start Date, End Date, Owner and Priority. You can also see the completed percentage of Milestones and Task Lists.
- Set dependency between tasks of the same or different projects. Know more about setting dependency using Milestone Gantt.
- Resize the panel's width to view more task details.
- Collapse All Task lists andExpand All Task lists in the Milestone Gantt. You can also convert the chart to a pdf file based on the following choices available:
- Fit to Width: Adjusts the data in the chart to the width of the page.
- Chart in View: The data in the chart is replicated as seen on screen.
- Show Task Owner: Shows or hides the task owner(s) names displayed near the task bar.
- Show Dates: Shows or hides the dates displayed near the task bar.
- Fit to Width: Adjusts the data in the chart to the width of the page.
- Click Max to maximize the Gantt bar or click Fit to fit the width and rescale the chart.
- Mouse over a specific task to view its task assignee, start date, end date, and predecessor/successor tasks in the task pop-up. From here you can also perform these actions:
- Click
 to add a new task above the respective task or sub task. The new task or sub task inserted is always at the same task level.
 - Click
 to bring the task's corresponding Gantt to view. Also, click the icon and draw a line to the target task to set a new dependency.
 - Click
 and drag a task between a set of tasks to reorder. Also, drag and place the task over another task to make it a sub task.
- Click
- On the vertical axis, the holidays are displayed in red and the weekends in blue.
- To access the Milestone Gantt across projects, navigate to Home > Global Reports(widget) > Milestone Gantt.
- Here, you can view the Milestone Gantts for all the projects in your company. If you wish to view the results for a specific project or a specific set of projects, click
 in the upper-right corner to filter the data based on Project.
- Here, you can view the Milestone Gantts for all the projects in your company. If you wish to view the results for a specific project or a specific set of projects, click
Recurring tasks in Gantt charts
The recurring tasks are displayed virtually in the Gantt charts based on their recurring frequency. Only the recurring task that is active is displayed as task bar, whereas the remaining recurring tasks are displayed in dotted lines, just as a reminder for your convenience about the project schedule. You can edit only the active recurring tasks; the virtual recurring tasks cannot be edited. And neither can you perform any actions on those virtual tasks.
Related Articles
What are the different Gantt chart views that can be created?
You have two Gantt charts to choose from: The Chronology Gantt view, which gives a visual perspective to the Tasks module. The Milestone Gantt view, which lets you view the milestones, task lists, and tasks on the left and the corresponding bars on ...Charts
A chart presents data from various records of a module(s) in a visual or graphical representation for an easy analysis. The data is seemingly comprehensible as users can easily pick out the patterns, trends, etc., which may otherwise be difficult to ...Project timeline Gantt
View all your project timelines on a Gantt chart. Feature Availability: All paid plans. Navigate to projects list view. Click on the drop-down panel and then click on Projects Timeline Gantt. View the gantt chart displaying all your projects and ...Dispatch Console Gantt
The Gantt view shows the service appointments in a timeline. To see the Gantt view, navigate to the Dispatch Console module and click the Gantt tab. All the scheduled service appointments for a field technician or crew will be shown in its row in the ...Project timeline Gantt
View all your project timelines on a Gantt chart. Feature Availability: All paid plans. Navigate to projects list view. Click on the drop-down panel and then click on Projects Timeline Gantt. View the gantt chart displaying all your projects and ...