You can choose to adjust the time frame for which you'd like to view the data on Zoho Social by clicking on the Calendar icon from the top bar on the Reports tab.
Facebook Reports
Facebook Summary
This card displays a summary of the people who liked your page and helps you keep a track of your audience growth by viewing the average Likes received and Likes lost on your posts.
This card will show you the engagement your posts have received. This way, you can track your top performing posts and the highest engagement received for the different types of posts you publish.
This card displays an overview of the performance of your page and the feedback it has received from your audience.
This card shows a summary of the Impressions your page received— that is, the number of times people have viewed your page. Here, you can track the reach of your page, as well— that is, the total number of people who actually viewed your page.
Facebook Audience
This card will show you a detailed graph about the growth of your Facebook Page by comparing the number of times people have liked your page with the number of Page Likes lost over time.
This card shows the number of people who liked your page organically, as well as the ones who liked your page through sponsored ads.
This card shows a list of sources from which people have reached out to your page and liked it and the subsequent card displays different sources on the internet from which people have unliked your page.
You can also track the top 5 countries from which people have liked your page.
This card displays the languages spoken by those who've liked your page.
This card displays the Like count from people based on the city they're from.
This card shows a split of the gender and age-group of the people who liked your page.
Facebook Posts & Engagement
The first card compares the number of posts published and the engagement received over a period of time.
This card shows a split count of the different types of posts published on your page.
This card shows you the top performing posts by analyzing the engagement rate such as, the number of reactions, comments, shares, etc.
This card displays the top 5 people who've interacted the most with your page.
This card shows the applications you've used to publish your posts on your page.
This card suggests the best time to publish your post by tracking your audience engagement.
These cards let you track the engagement you've received on your posts based on the type of posts you have published.
This card lets you track different types of interactions from your audience in the form of Shares, Comments, Likes, etc.
This card lists out the types of reactions for each post.
This card shows the number of Visitor Posts your page and lists the type of Visitor posts.
The first card compares the number of people who logged into Facebook and viewed your post with the ones that didn't log in.
The second card shows the various tabs that were viewed by your audience when they visited your page.
The third and the fourth card shows a distribution of the number of people who viewed your page within Facebook and the people who viewed your page through sources on the internet outside Facebook.
The next two cards shows a split of the gender and age-group of the people who viewed your page.
The seventh and eighth card tracks and compares number of times with the number of people who viewed your page and a distribution of clicks based on the types of posts published.
The next two cards shows the volume of positive and negative feedback on your page—for example, when someone chooses to like your posts or hide them from their timeline.
The last two cards display the the number times people have clicked on your page CTAs and shows a distribution of the different types of CTA clicks on your page.
Facebook Reach & Impression
The first two cards compare the number of times your page was viewed (Impressions) with the total number of people who actually viewed your page (Reach). It also shows a split to differentiate organic and paid Page Impressions from organic and paid Page Reach.
The third card compares the number of times your page was viewed by your followers (Non-Viral Impressions) and non-followers (Viral Impressions) with the total number of followers who viewed your page (Non-Viral Reach) and those who don't follow you (Viral Reach). The next card shows the reach of your page outside your follower base by tracking types of ways in which your followers have shared your posts or mentioned your page.
The 5th and 6th card compares the total number of times people have viewed a shared post about your page with the number of people who viewed these shared posts—the card also lists the different types of Page Shares, in the form of— Page Posts, Mentions, Events, etc.
The next few cards display the top 5 countries from which people have viewed your page—this is further split by the languages spoken, the cities they belong to, their gender, and the age-group distribution.
The first card shows the summary of the number of new people who followed your profile and the number of people who have unfollowed your profile.
The next card displays your top performing tweet by tracking the number of posts published and the engagement your post received over a period of time.
This card displays a total number of people who followed your Twitter Profile and the average growth count per day.
The first two cards compares the number of tweets published with the volume of engagement over a period of time and the different types of tweets posted, in the form of—Links, Images, Videos, etc.
The next two cards list the top performing tweets based on the engagement rate such as number of Likes, Comments, Retweets, etc and the top Connections who've engaged the most with your profile, through Likes, Retweets, Comments, etc.
The 5th card lists the applications that were used to post your tweets.
The next card tells you the best time to publish tweets based on the times when your audience is most active.
The 7th and 8th card displays the total number of engagement your post received and shows a split to differentiate the engagement received on different types of tweets, such as Images, Videos, Links, etc.
The last two cards let you track the volume of different Engagement Actions such as Likes, Retweets, Replies, and also display the volumes of DMs and mentions received over a period of time.
LinkedIn Reports
LinkedIn Summary
The first card shows a summary of the number of people who have followed your page, by analyzing number of new followers gained organically and through sponsored ads., You can also track the top countries where your followers are located.
The second card shows a summary of the total number of posts you've published on your page and the engagement each post has received. You can also view the top performing post and the engagement received for different types of posts, such as Links, Images, Videos, etc.
The final card shows an overview of the performance of your page by tracking the number of times people viewed your page (Impressions) and the number of people who viewed your page (Reach).
LinkedIn Audience
The first two cards show the total and average number of people who have followed your Page. They also show a breakup of your organic followers and sponsored followers.
The next few cards display a distribution of your followers based on the top 5 countries they're from, their job industries, job functions, seniority level, and the company size.
LinkedIn Posts & Engagement
The first two cards compare the number of posts published on your page with the volume of the engagement received. You can also view a split between the types of posts published such as Links, Images, Videos, etc.
The second card shows the top performing post based on the Engagement Rate, such as— the number of Likes, Comments, Shares received, etc.
The third card lists the applications that were used publish posts on your LinkedIn page.
The last two cards show the volume of engagement actions, such as— Likes, Comments, and Shares received for various types of posts, such as— Links, Images, Videos, etc.
The first card compares the number of times people viewed your page (Impressions) with the total number of people who actually viewed your page (Reach). The second cards goes on to share the number of clicks your page received over a period of time.
Instagram Reports
Instagram Summary
The first card tracks the total and average number of new followers, displaying a summary of the total number of people who've followed your page.
The second card shows a summary of the posts you've published on your Instagram Business Profile, as well as the total and average volume of engagement received. The card also displays the top performing post on Instagram.
Instagram Audience
This card displays a total number of people who followed your Instagram Profile and the average follower growth count per day.
Instagram Posts & Engagement
The first two cards compare the number of posts published on your page with the volume of the engagement received. You can also view a split between the types of posts published such as Links, Images, Videos, etc.
The third card shows the top performing post based on the Engagement Rate, such as— the number of Likes, Comments, Shares received, etc.
The fourth card displays the best time to post based on engagement rate.
The 5th and 6th card show the volume of engagement received on posts and shows a breakup of the types of posts published on your profile, such as — Carousel, Video, Image, etc.
The last two cards show the volume of different engagement actions your posts received, such as Likes and Comments. You can also see the different types of Instagram filters you've used for your published posts.
Google My Business Reports
Google My Business Summary
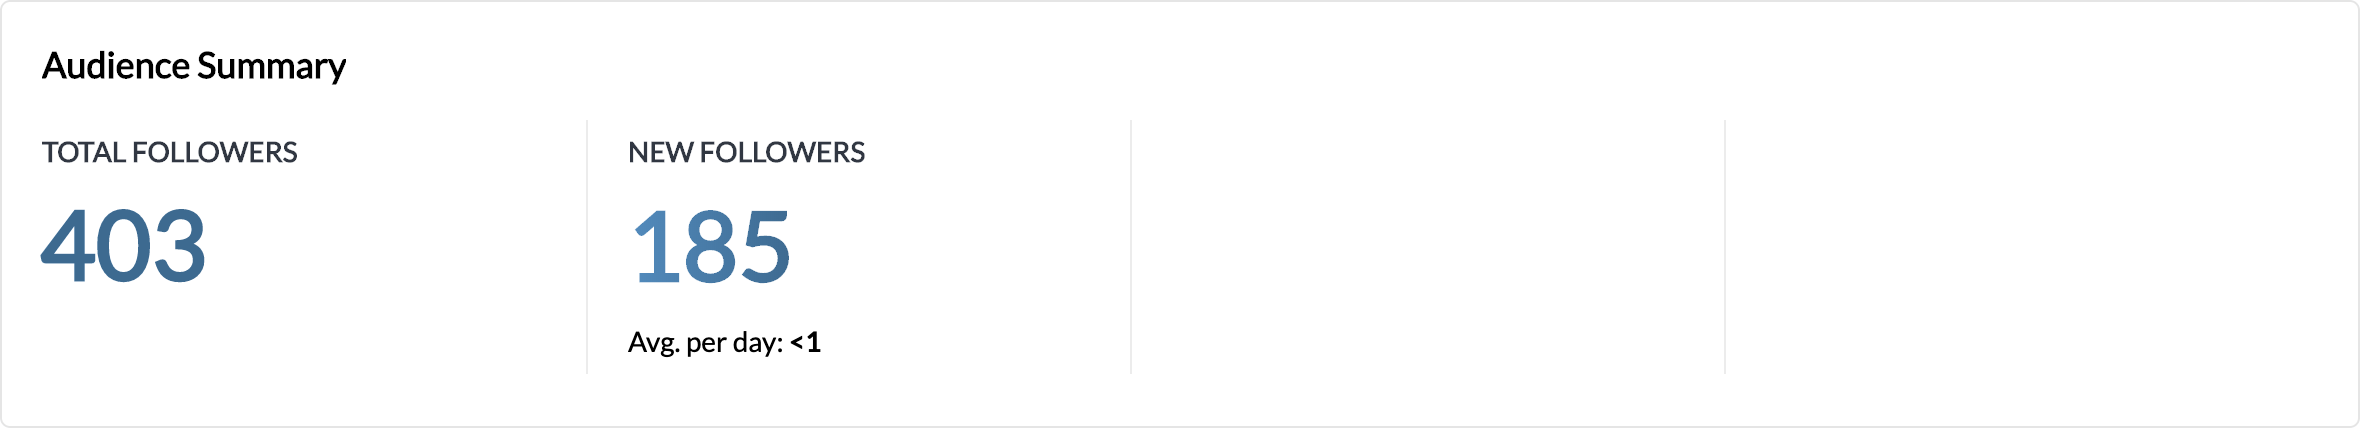
This card shows a summary of total followers on your Google My Business listing, along with the new followers gained.
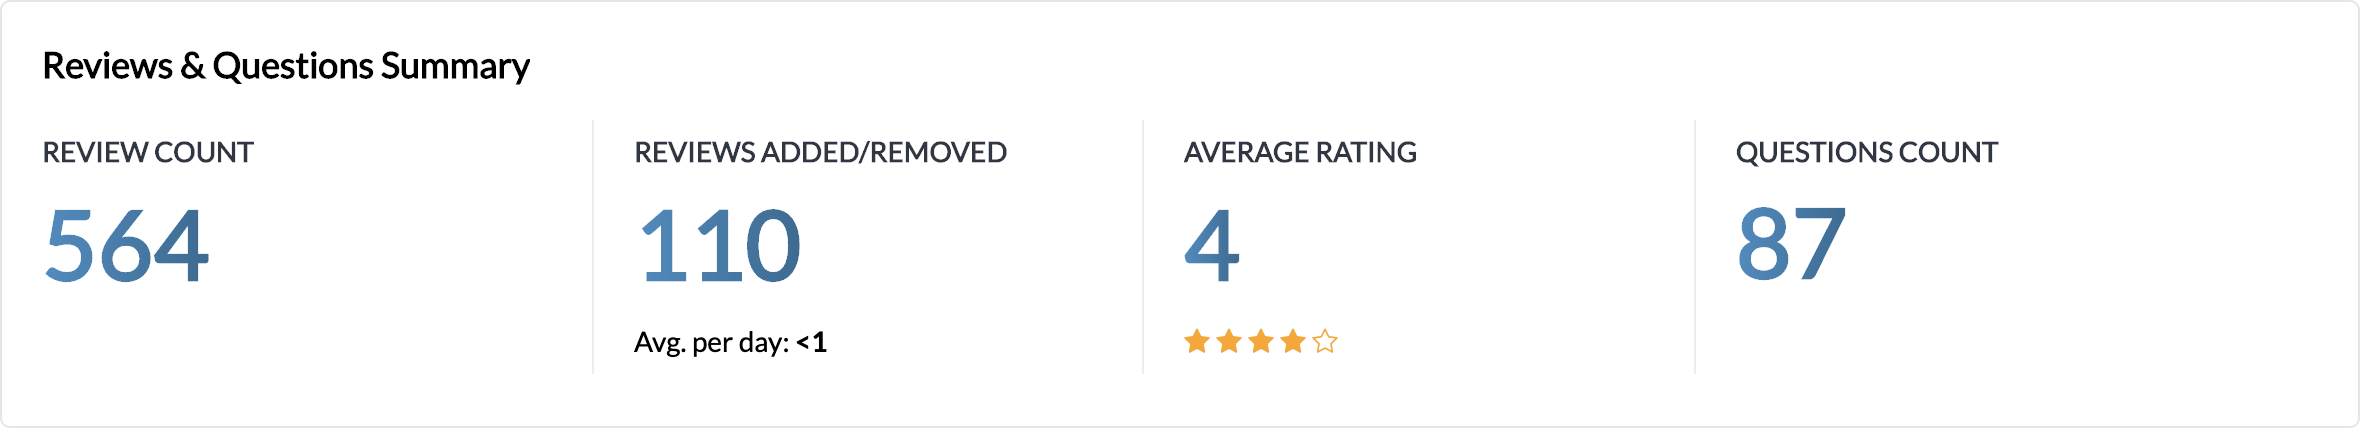
This card shows a summary of the number of reviews on your Google My Business listing, the reviews added and removed. It also shows your average rating and the question count.
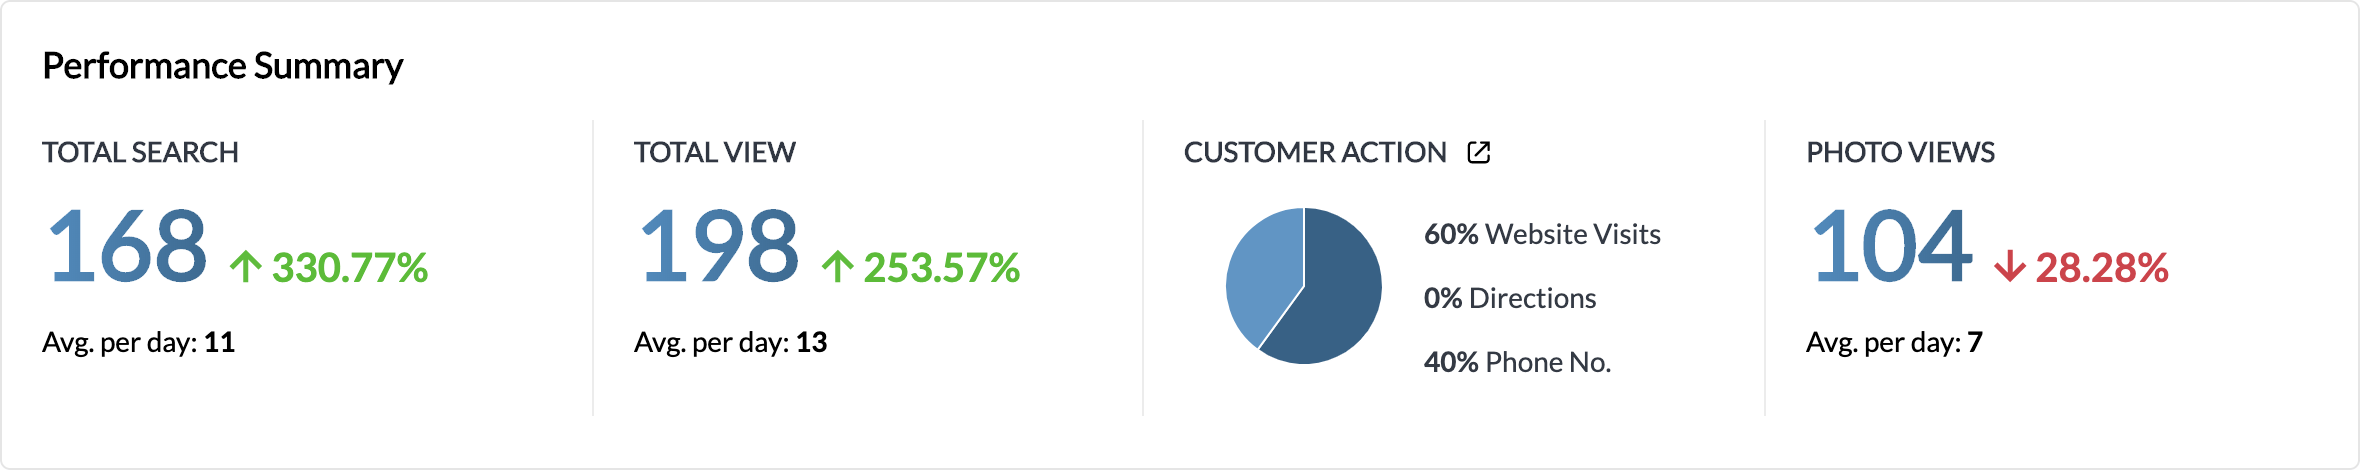
This card shows a summary of the total number of searches for your Google My Business listing along with the total views and views on photos. This also shows the actions taken by your customers.
Google My Business Audience
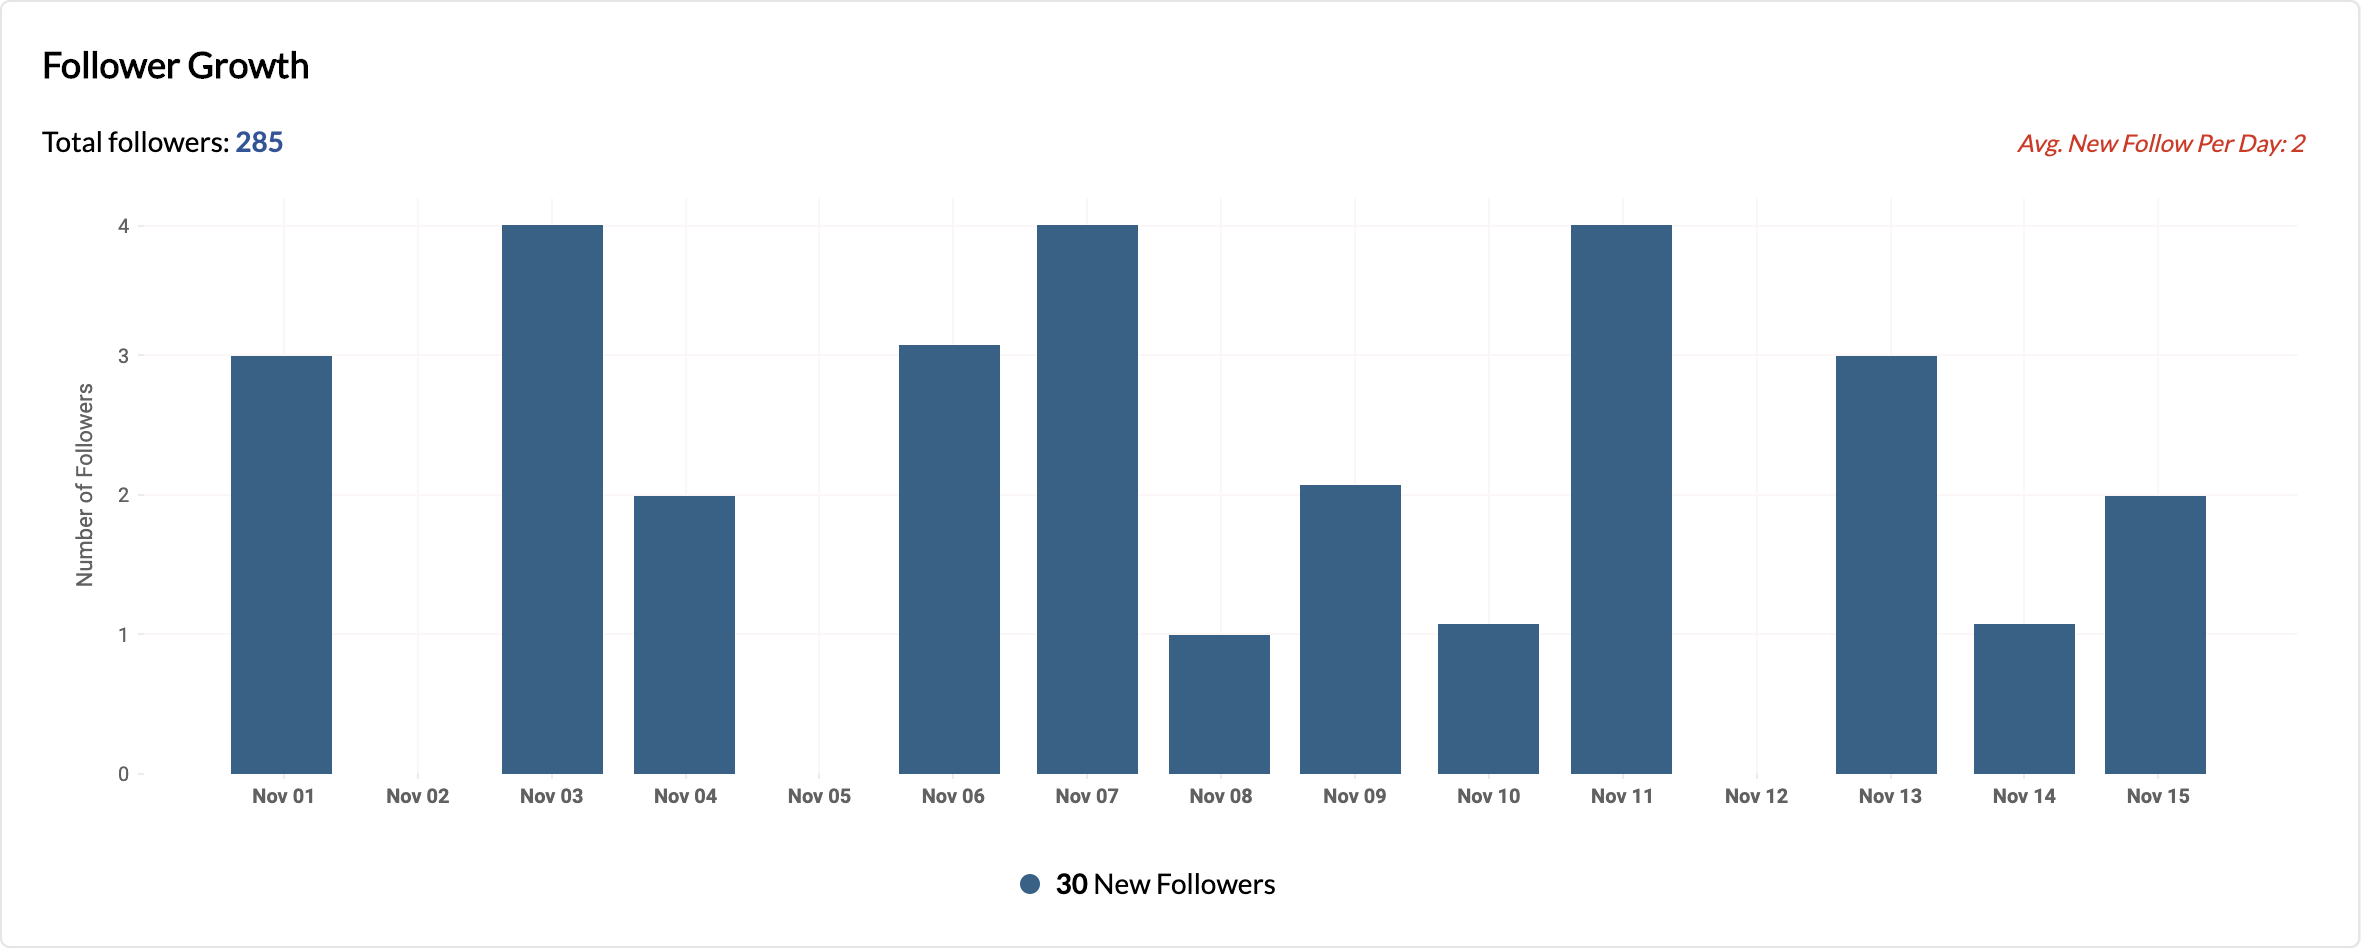
This card shows the total number of New Followers gained by your Google My Business listing along with the average number of New Followers gained per day, over a period.
Google My Business Reviews and Questions

This card shows the trends in number of reviews received on your Google My Business per day, over a period.
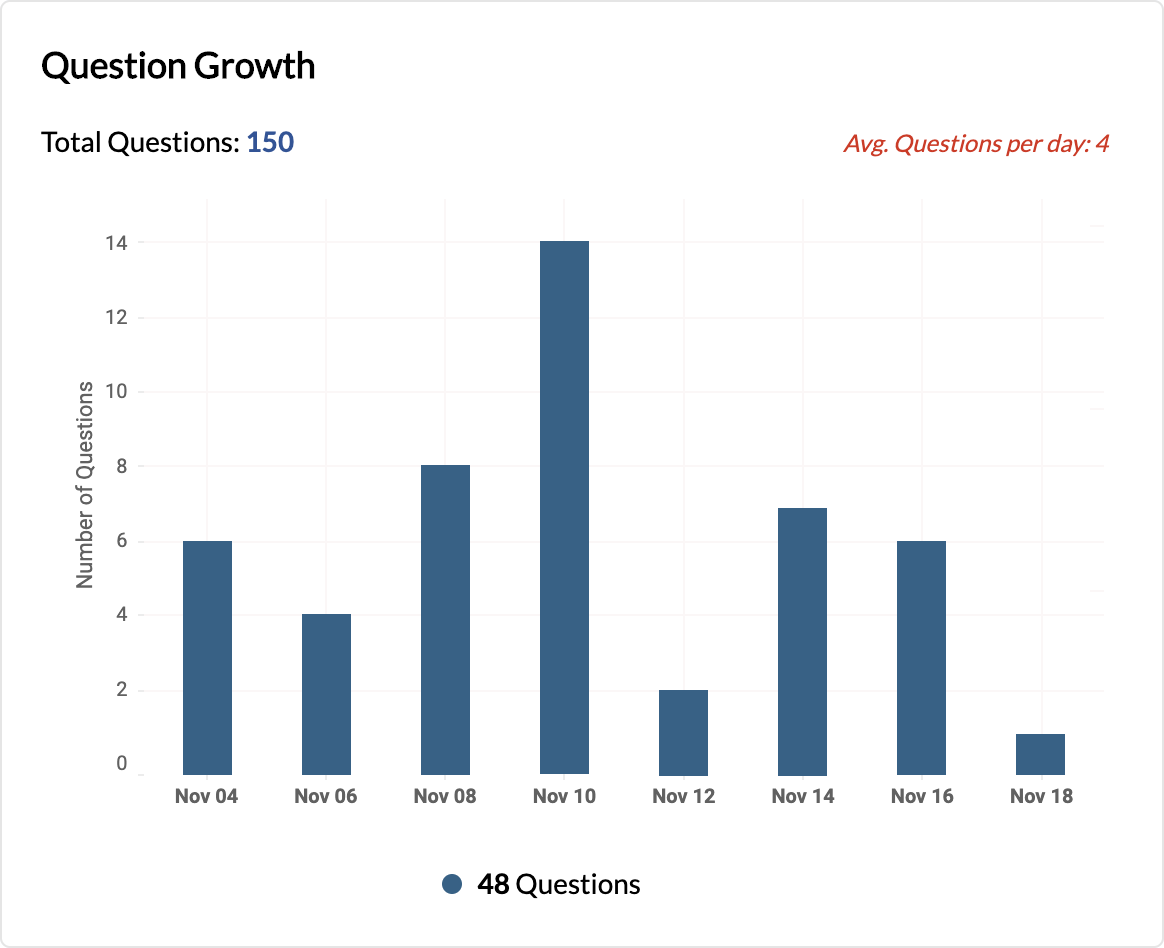
This card shows the trends in number of questions received on your Google My Business per day, over a period.
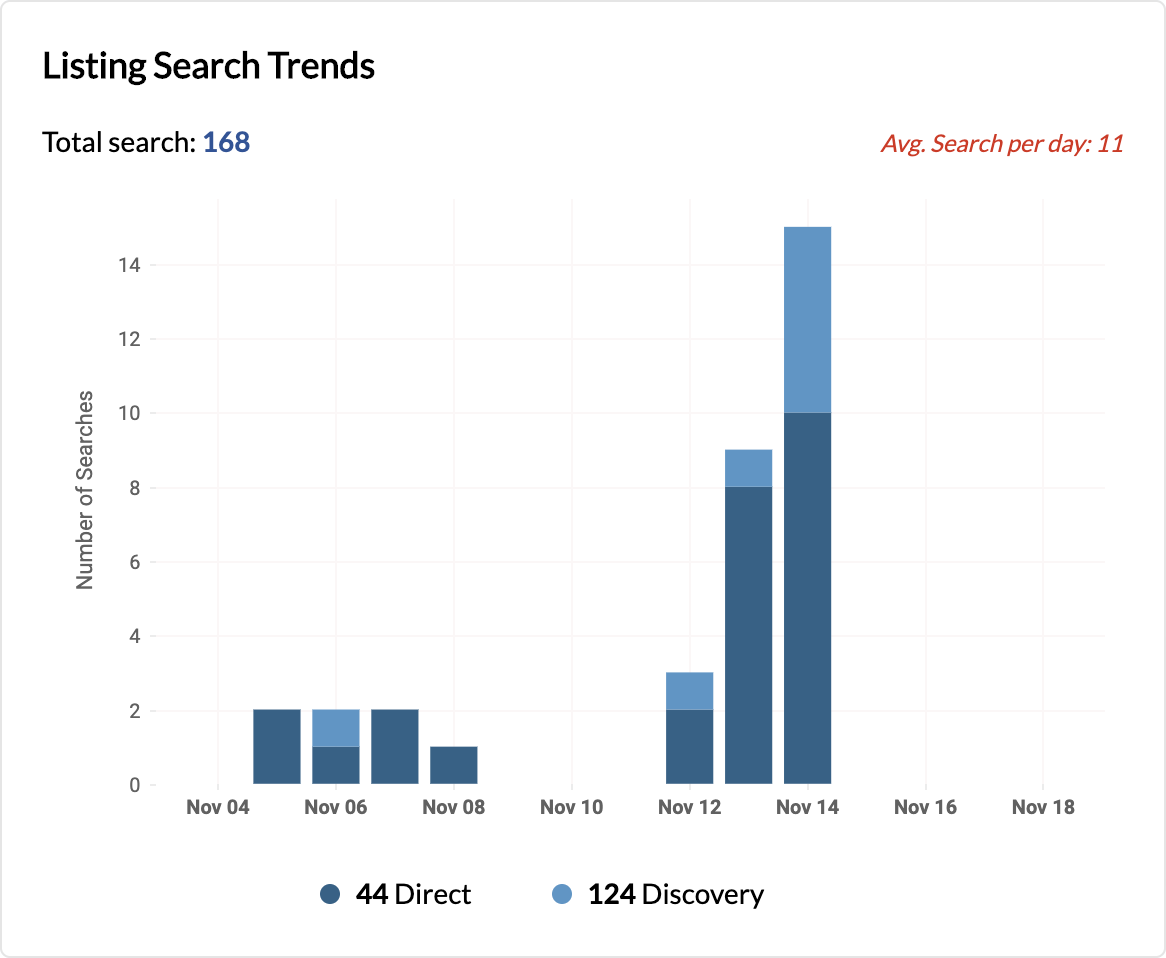
This card shows trends on how your visitors have searched for your listing through either direct search or discovery.
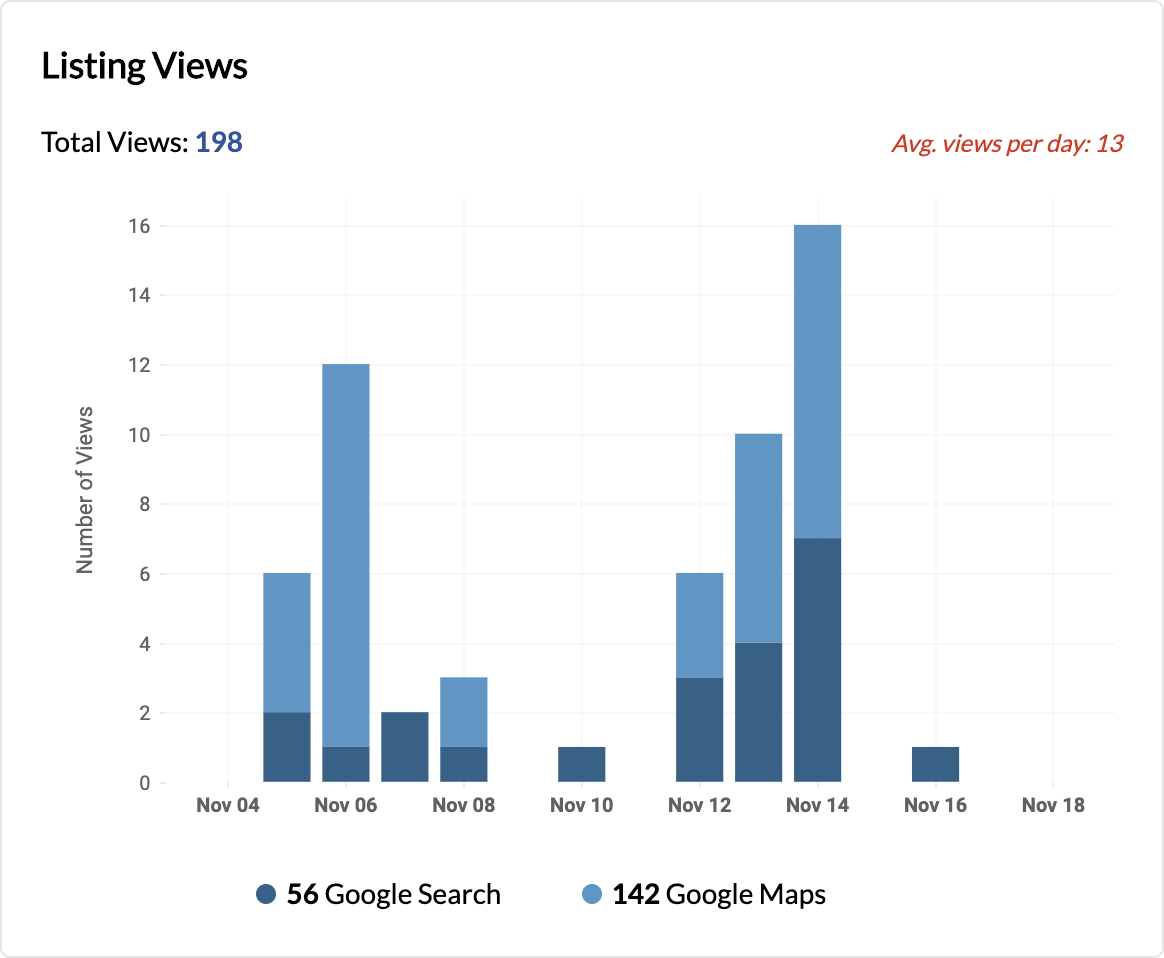
This card shows trends on how your visitors have viewed your listing with Google Search and Google Maps.
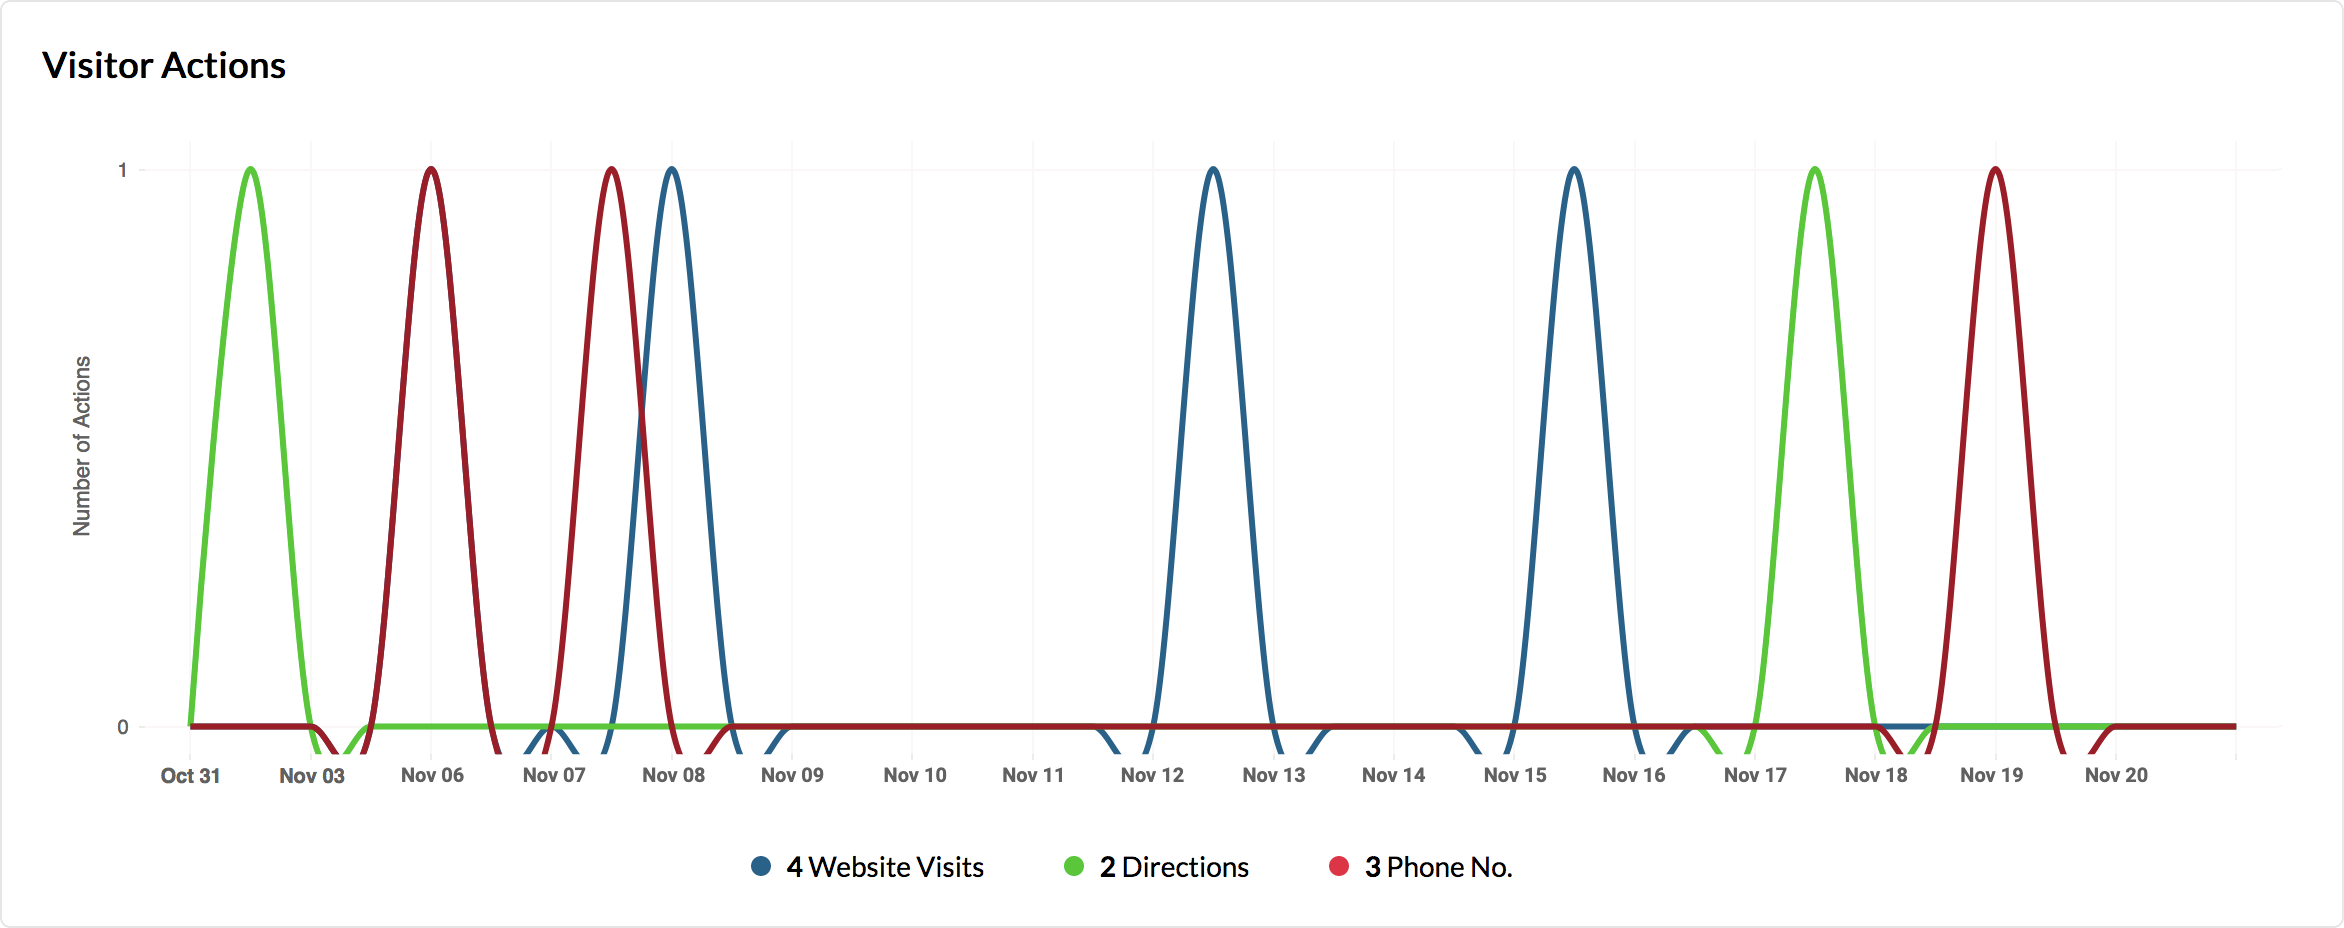
This card shows the different actions visitors have taken on your listing, over a period.
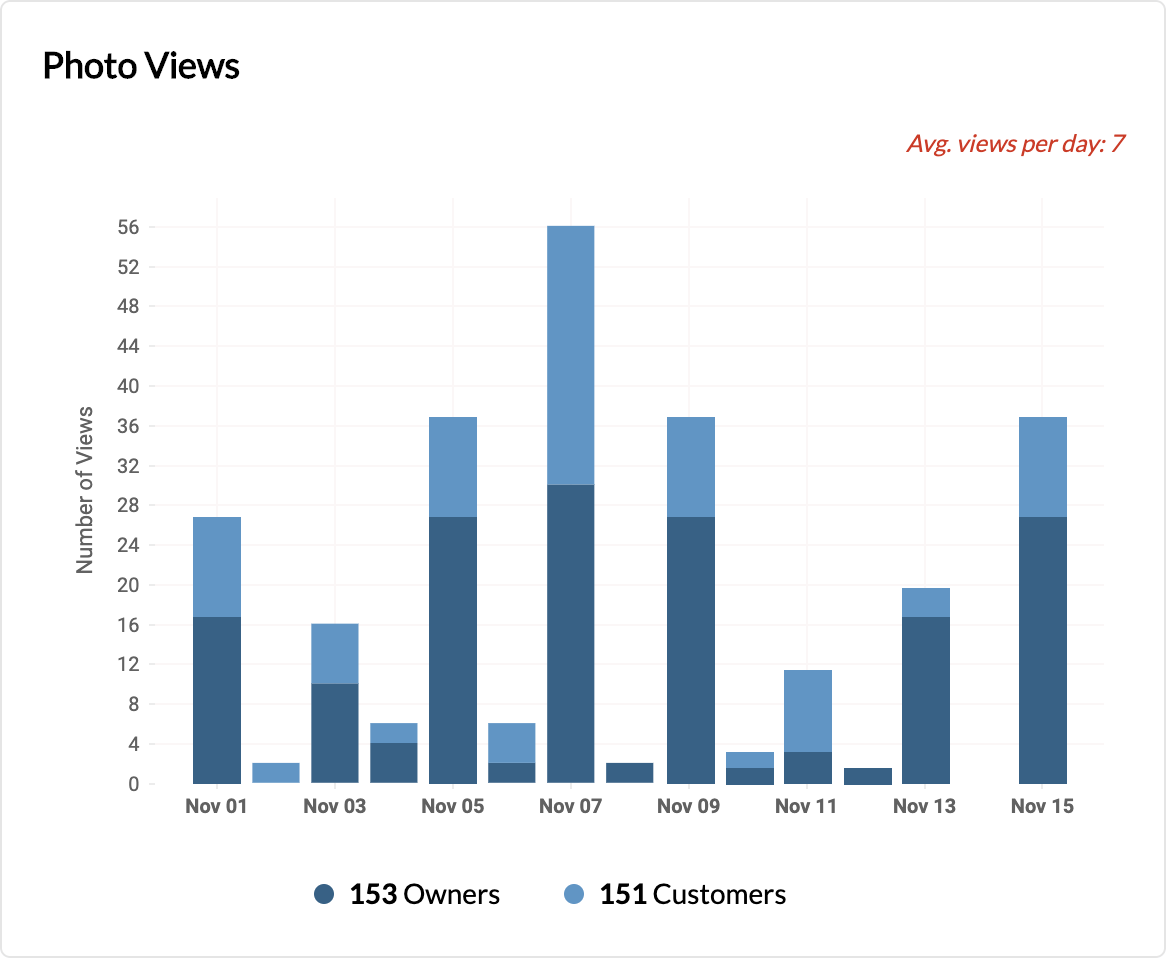
This card shows the views on photos uploaded by the owners and customers over a period.
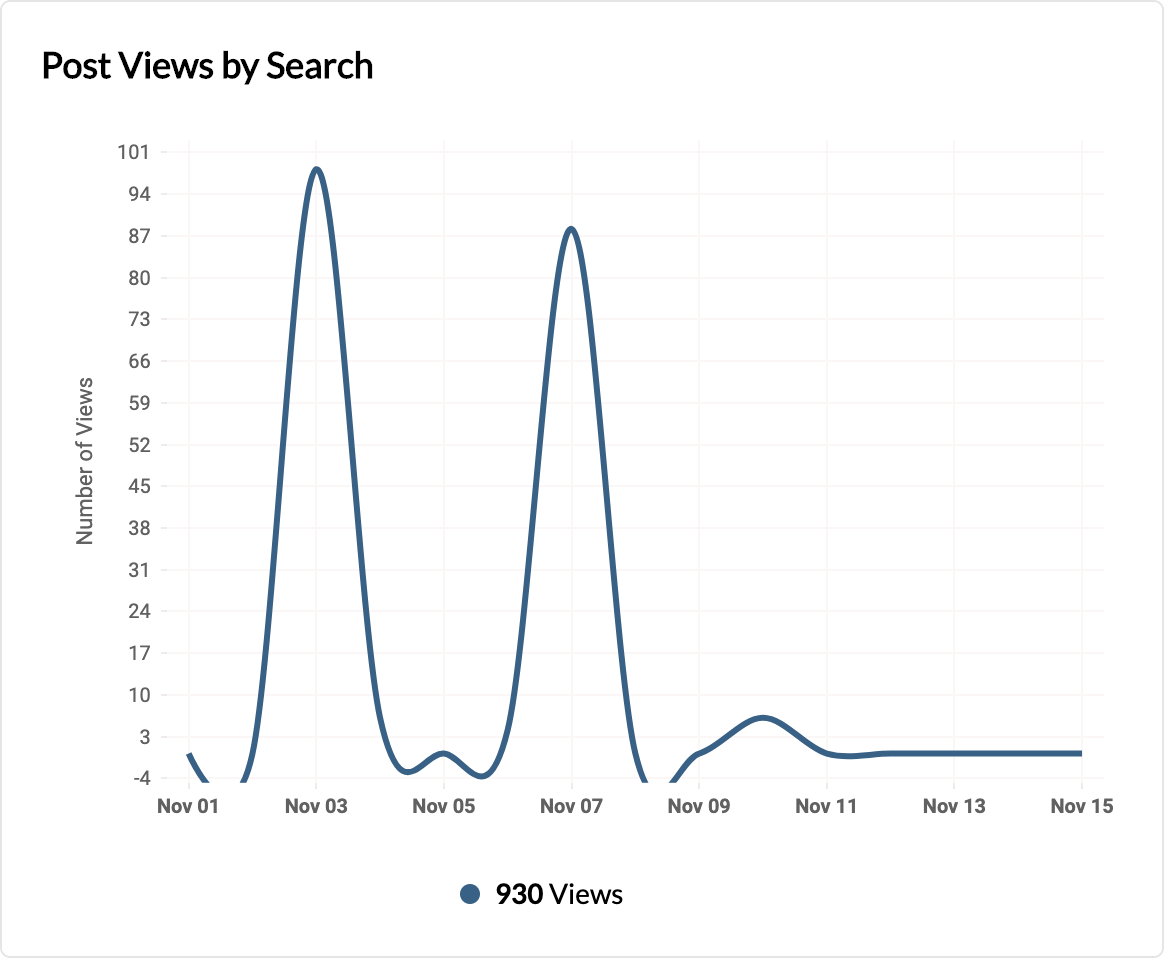
This card shows the number of post views by search over a period.
Further Reading
- Learn more about Discussing, Scheduling, and Exporting Reports.
- Learn how you can create and manage Custom Dashboards on Zoho Social.
Zoho CRM— Leads
For all those who have integrated Zoho CRM to their Zoho Social, there are built-in reports to track three variables - Leads and Contacts created, network potentials, and revenue generated from the Leads and Contacts who interacted with you on social media. This is available as a feature called CRM Reports. You can track how your brand is performing by checking which social channel is helping you generate the maximum amount of revenue.
To view CRM Reports, you will first need to integrate Zoho Social with your Zoho CRM account. When generating leads, you will have the option to add them as either CRM Leads or CRM Contacts.
Leads are the Connections who have provided their contact information and have the potential to be converted into CRM Contacts.
Contacts are the Leads that you have already contacted and have ongoing interactions with.
Exporting CRM Reports
Follow these steps to export Reports as PDF or PNG files:
