How do I create a custom report for my survey?
You can select questions and create customized reports. These reports can be shared or chosen by filter to show responses for specific questions.
To create a custom report:
- Click Create in the Custom Report section.
- Enter a name in the Report name box.
- Select the Average Ratings checkbox to include a section that consolidates the results of all the rating type questions you have selected in your custom report. Note: This field is available only when you have multiple rating type questions in your survey. Your custom report must include at least two rating type questions for this section to appear.

- Select Special Statistics checkbox to include survey visits and response status in the report.
- Select the questions you want to include in the report.
- Click Select all to include all questions.
- Select the checkbox next to a page number to select all questions from that page.
- Click
 to hide all questions from a particular section.
 - Click the display option next to each question to select the type of report you want to generate.
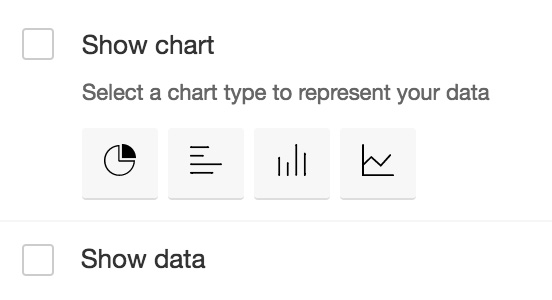
- Select Show chart to select a chart to display your reports along with labels.
- Select Show data to show data without a chart.
- Select Show stats to display statistics.
 Note: Questions that don't support chart reporting will display just the data by default. You can also select all display options (Chart, Data, and Stats) for supported questions.
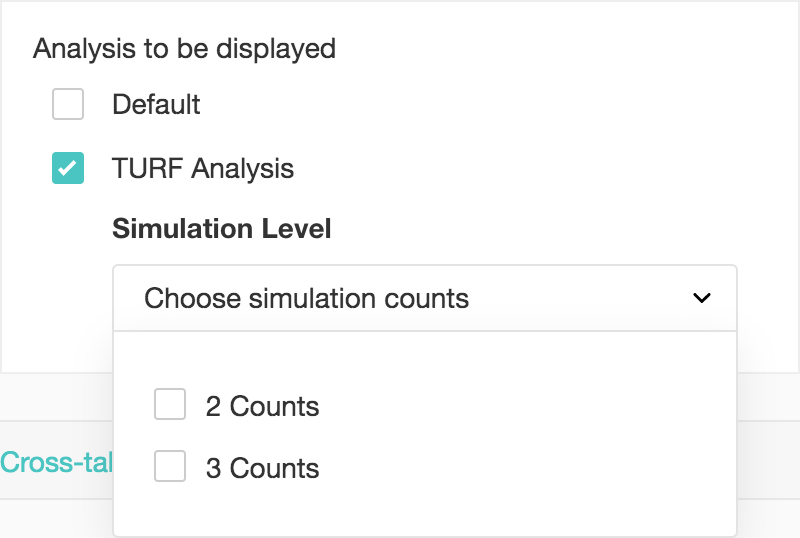
 - Select the TURF Analysis checkbox and select a simulation count from the Simulation Level dropdown. Here's a slightly more detailed description of TURF analysis.
 This option only appears in Multiple Choice (Many Answers) type questions with three to ten choices in them.
 - Click Save.
Related Articles
How do I have my Shopify customer information shown in my Zoho Survey report? (Shopify merge tags)
To save your customer information in your survey report: Select the survey you want to send in the Select a Survey dropdown list. If you haven't created any surveys yet, click Create a New Survey or select a survey from one of our pre-built ...Survey-based Campaigns
Zoho Campaigns integrates with SurveyMonkey and Zoho Survey to send survey-based email campaigns. This not only provides the valuable feedback of your service, but is also a great way to get the pulse of the market for your future strategies. ...Glossary of Survey Terms
Do you find it difficult to understand the meaning and functionality of some terms you see in Zoho Survey? To help you out, we've come up with a glossary of all those terms you should know when using an online survey tool. Read on to learn about ...In-mail Survey
In-mail surveys are perfect when you want to embed a short survey in your email. Type in your question and your survey is ready. In-mail surveys can have only one question and it generates an HTML setup that can work with any email marketing ...In-mail Survey
In-mail surveys are perfect when you want to embed a short survey in your email. Type in your question and your survey is ready. In-mail surveys can have only one question and it generates an HTML setup that can work with any email marketing ...