How do I create a trend report for my survey?
Trend reports are used to compare and analyze trends in aggregate survey responses.
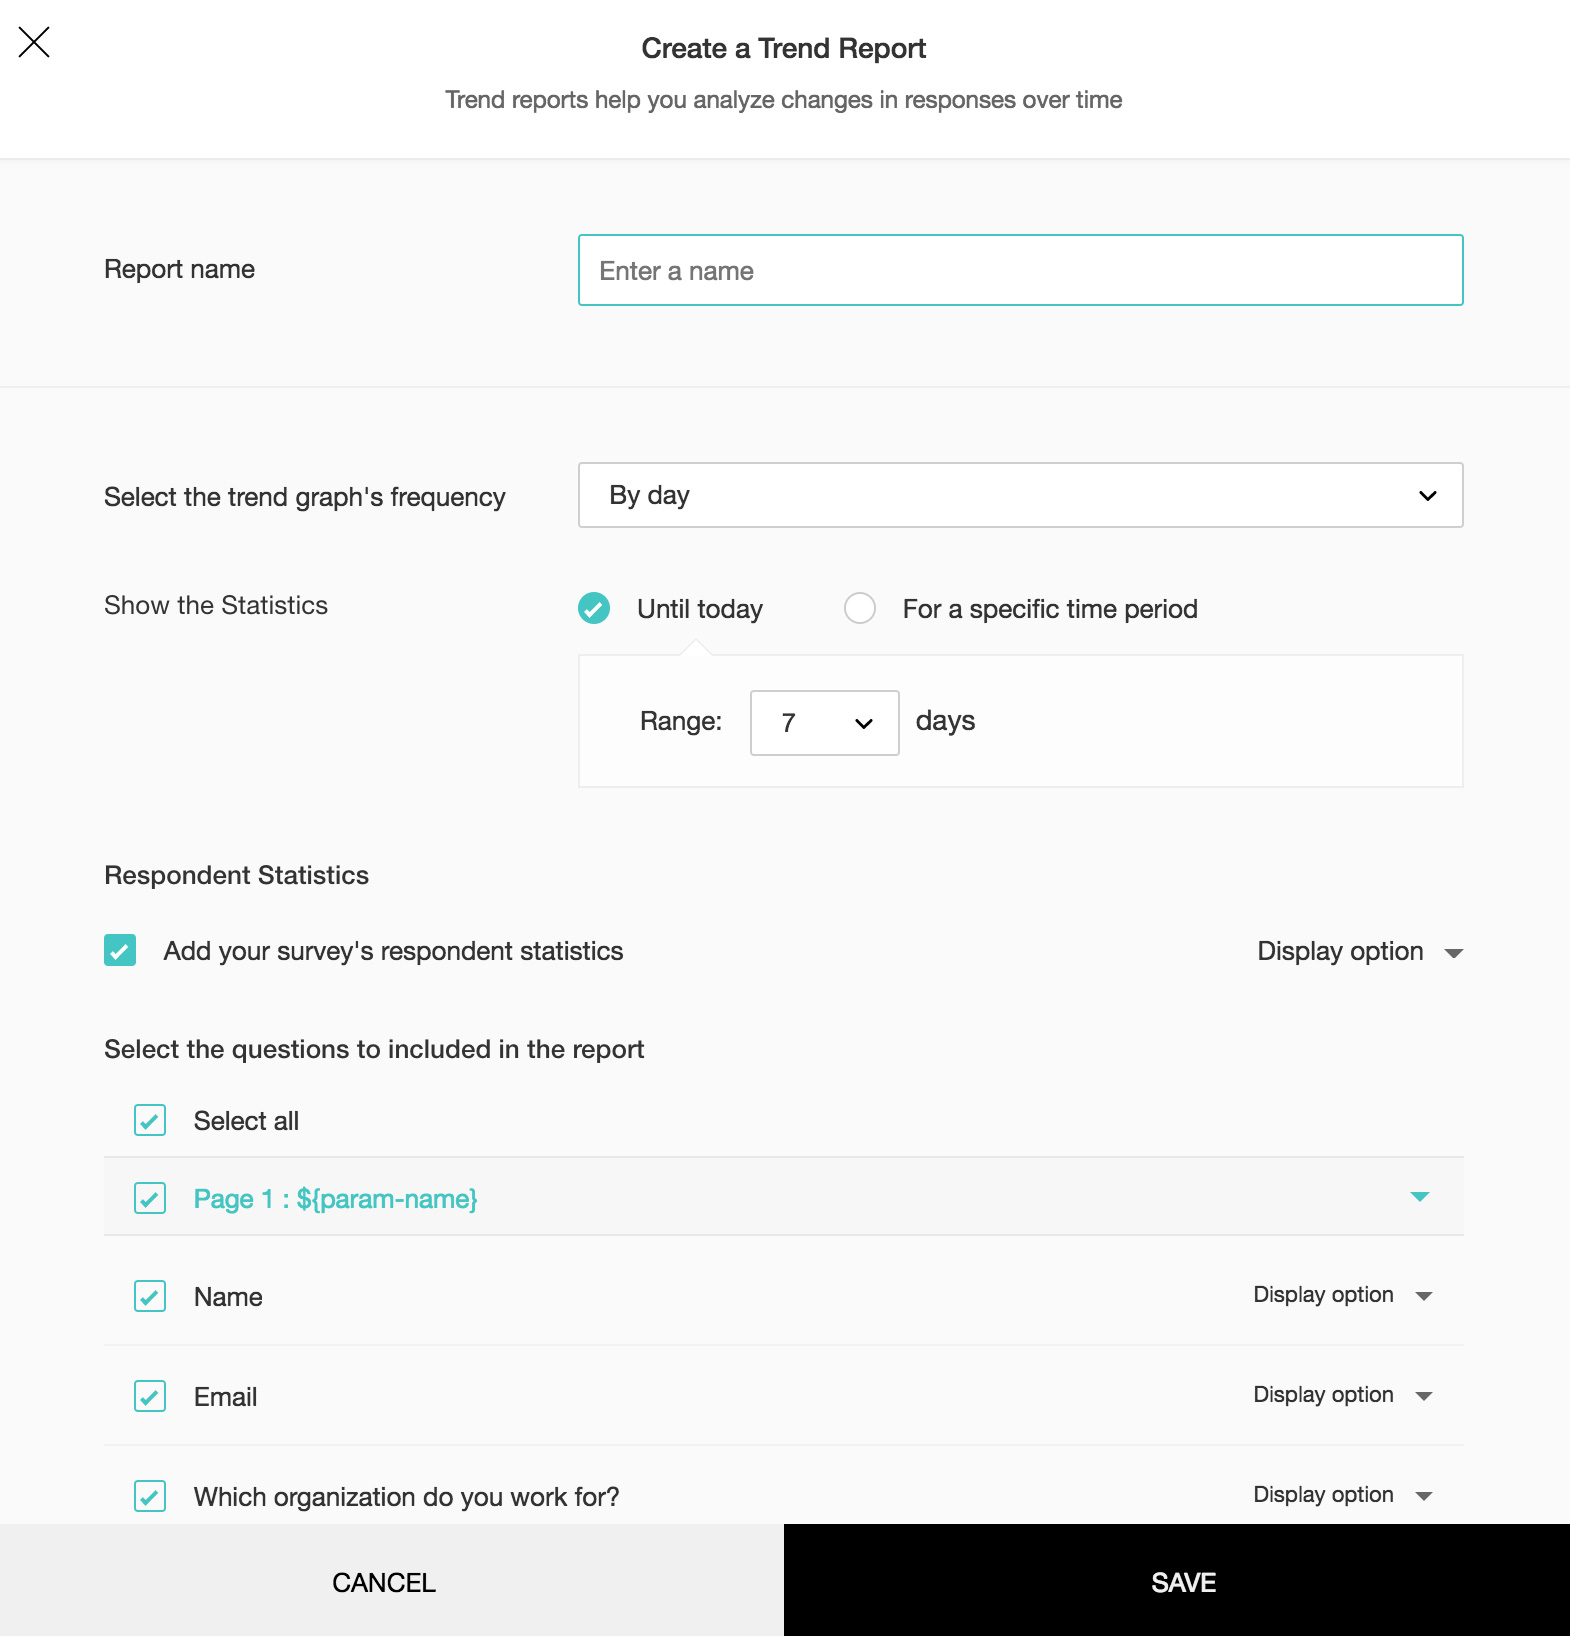
To create a trend report:
- Click Create in the Trend Report section.
- Enter a name in the Report name box.
- Select a trend frequency for your graph from the dropdown.
- Click Until today and select a range to display the trend statistics.
- Select For a specific time period to select a time range.
- Select dates in the From and To calendars.
- Select the Respondent Statistics checkbox to add your survey's respondent statistics in the report.
- Select the questions you want to include in the report.
- Choose Select all button if you want to include all the questions.
- Select the checkbox next to the page number to select all the questions from that page.
- Click
 to hide questions from a particular section. Click the Display option next each question to select the type of report you want to generate.
 - Select Show chart to select a chart to display your reports along with labels.
- Select Show data to show the data without a chart.
- Select Show stats to display statistics. If questions don't support chart reporting, only the data will be displayed by default. You can select all display options (Chart, Data, and Stats) for questions that support them.
- Click Save .
Related Articles
Glossary of Survey Terms
Do you find it difficult to understand the meaning and functionality of some terms you see in Zoho Survey? To help you out, we've come up with a glossary of all those terms you should know when using an online survey tool. Read on to learn about ...How do I delete a trend report of my survey?
To delete a trend report: Click Reports on the left pane. Hover over the trend report you want to delete. Click to delete the report, then click Delete to confirm your selection.How do I edit a trend report of my survey?
To edit a trend report: Click Trend Report on the left pane. Click the day/week/month/quarter or select a trend report. Click to edit the report. Click to select display options. Click or to export the graph to JPEG or PDF.How do I create a custom report for my survey?
You can select questions and create customized reports. These reports can be shared or chosen by filter to show responses for specific questions. To create a custom report: Click Create in the Custom Report section. Enter a name in the Report ...Reports
Reports Reports provide valuable statistics to help you interpret survey results. Read more on reports. Custom Report Drill down on your reports by bringing focus to a few questions through Custom Reports. Learn how to customize your report. ...