Project timeline Gantt
View all your project timelines on a Gantt chart.

Feature Availability: All paid plans.
- Navigate to projects list view.
- Click on the drop-down panel and then click on Projects Timeline Gantt.
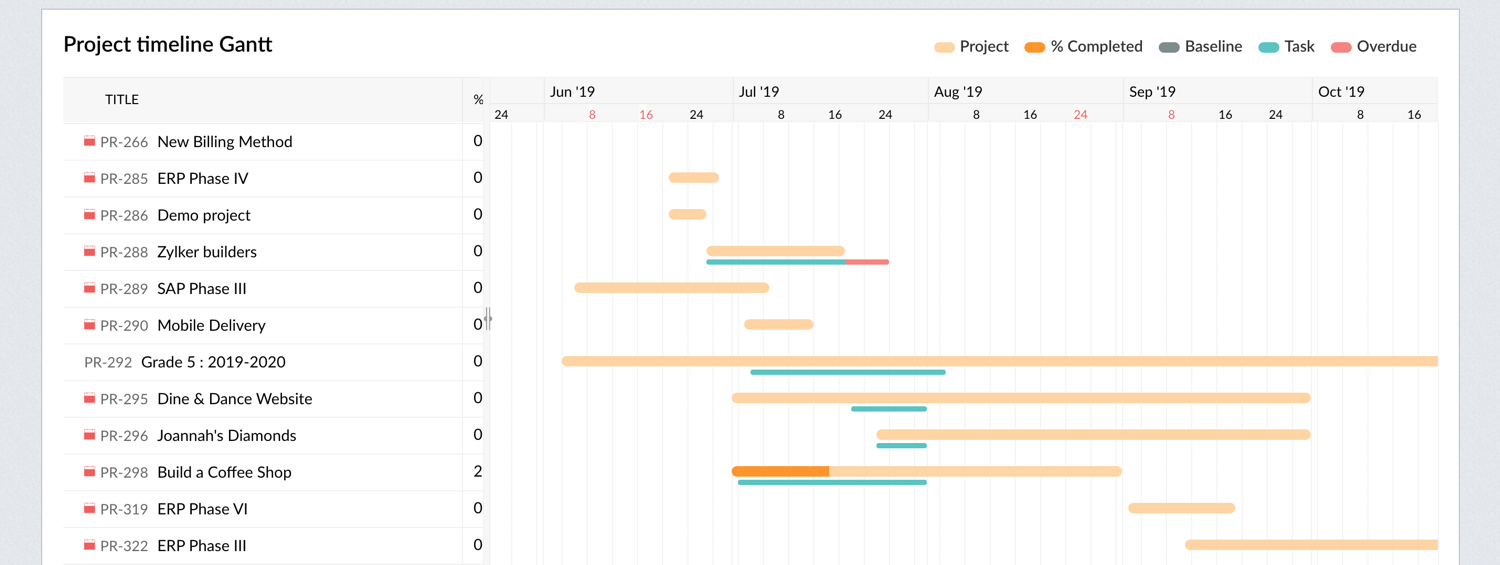
- View the gantt chart displaying all your projects and their timeline.
- View project timeline, task timeline (earliest starting and latest ending task), overdue task schedule, baseline (only in Enterprise plan), and % completion of the project.
- Click on the project or the timeline to open the projects dashboard.
- Click and drag a line from the parent task to the target task in the Gantt chart to create task dependency.
- Sort the Project timeline Gantt by project creation date, project start date, or project end date.
- The chart displayed is plotted for 3 consecutive years - previous year, current year and next year. For instance, if the current year is 2018, the timeline gantt will show data from 2017 to 2019.