Tracking Form Analytics using PageSense Integration
You can use web forms to capture feedback and support tickets directly from your website, portal or any third party web page. All it takes is to configure the form in Zoho Desk and embed the code snippet on your website. So far so good! But what if you want to know the number of unique visitors to the form, how many visitors start filling it out, how many abandoned, which fields are being ignored, etc. This is where Zoho PageSense comes in.
Zoho Desk brings the power of Form Analytics to your web forms by integrating with Zoho PageSense—the website optimization software. Form Analytics measures micro-interactions in your web forms and gives you powerful insights into how your visitors interact with them. It captures every interaction that every visitor makes in your forms, and turn that into easy-to-understand reports that can be accessed from inside Zoho Desk.
What You Get
- A free account on Zoho PageSense that allows you to track up to 5,000 visitors a month.
- Reports on form metrics like the “Form conversion rate”, “Number of form visitors”, “Number of starters” and others performances over time.
- Reports on how your users interact with your form fields like the "Focuses", "Drop-offs" and others performances over time.
- Ability to apply segments to the form reports that can help you isolate the form submission behavior of specific audience types.
Enabling Form Analytics
Zoho PageSense powers Form Analytics in Zoho Desk. So, when you enable Form Analytics, you also automatically create a PageSense account. If you already have a PageSense account, you will create a project linked with Zoho Desk.
To enable Form Analytics:
To enable Goal Metrics:
- Click the Setup icon (
) in the top bar.
- In the Setup Landing page, click Help Center under Channels.
- In the Rebrand page, click PageSense from the left panel.
- On the PageSense Integration page, select the checkbox to provide your consent for the collection, use, or disclosure of data.
- Click Enable and then click Continue on the Zoho PageSense Integration pop-up window.
- On the following screen, enable the toggle corresponding to Form Analytics for Web Forms.
You will now be automatically signed up for an account (i.e., portal) on PageSense of which you will be the administrator. Also, a project linked to the Zoho Desk gets created under the new PageSense account.
Note:
- If you already have a PageSense account, a new project linked to Zoho Desk gets created.
Setting up Form Tracking
Now that you've enabled Form Analytics any new forms you create will automatically add an experiment in PageSense. However, you must open, edit and save your existing forms to add its equivalent experiment in PageSense. Also, keep in mind to update their new code snippets on your webpages since only then can they track visitors.
Accessing Form Analytics Metrics
New Dashboard Folders namely, Feedback Widget and Advanced Web Forms are created on adding or updating a form in Zoho Desk. It is under these folders that the dashboards for individual forms reside. For example, when you create a feedback widget 'Contact Us', a dashboard named 'Contact Us' is created under the Feedback Widget folder. You can track the form's analytics on this dashboard.
You can access these dashboards under Reports > Dashboards > Feedback Widget / Advanced Web Forms.
Understanding Form Analytics Metrics
The form analytics dashboard provides data for two primary metrics: Form Metrics and Field Metrics. Let's look at each of these in little more detail.
Form Metrics
The form metrics dashboard explains how your online form has evolved over a period of time. It provides data for the following metrics:
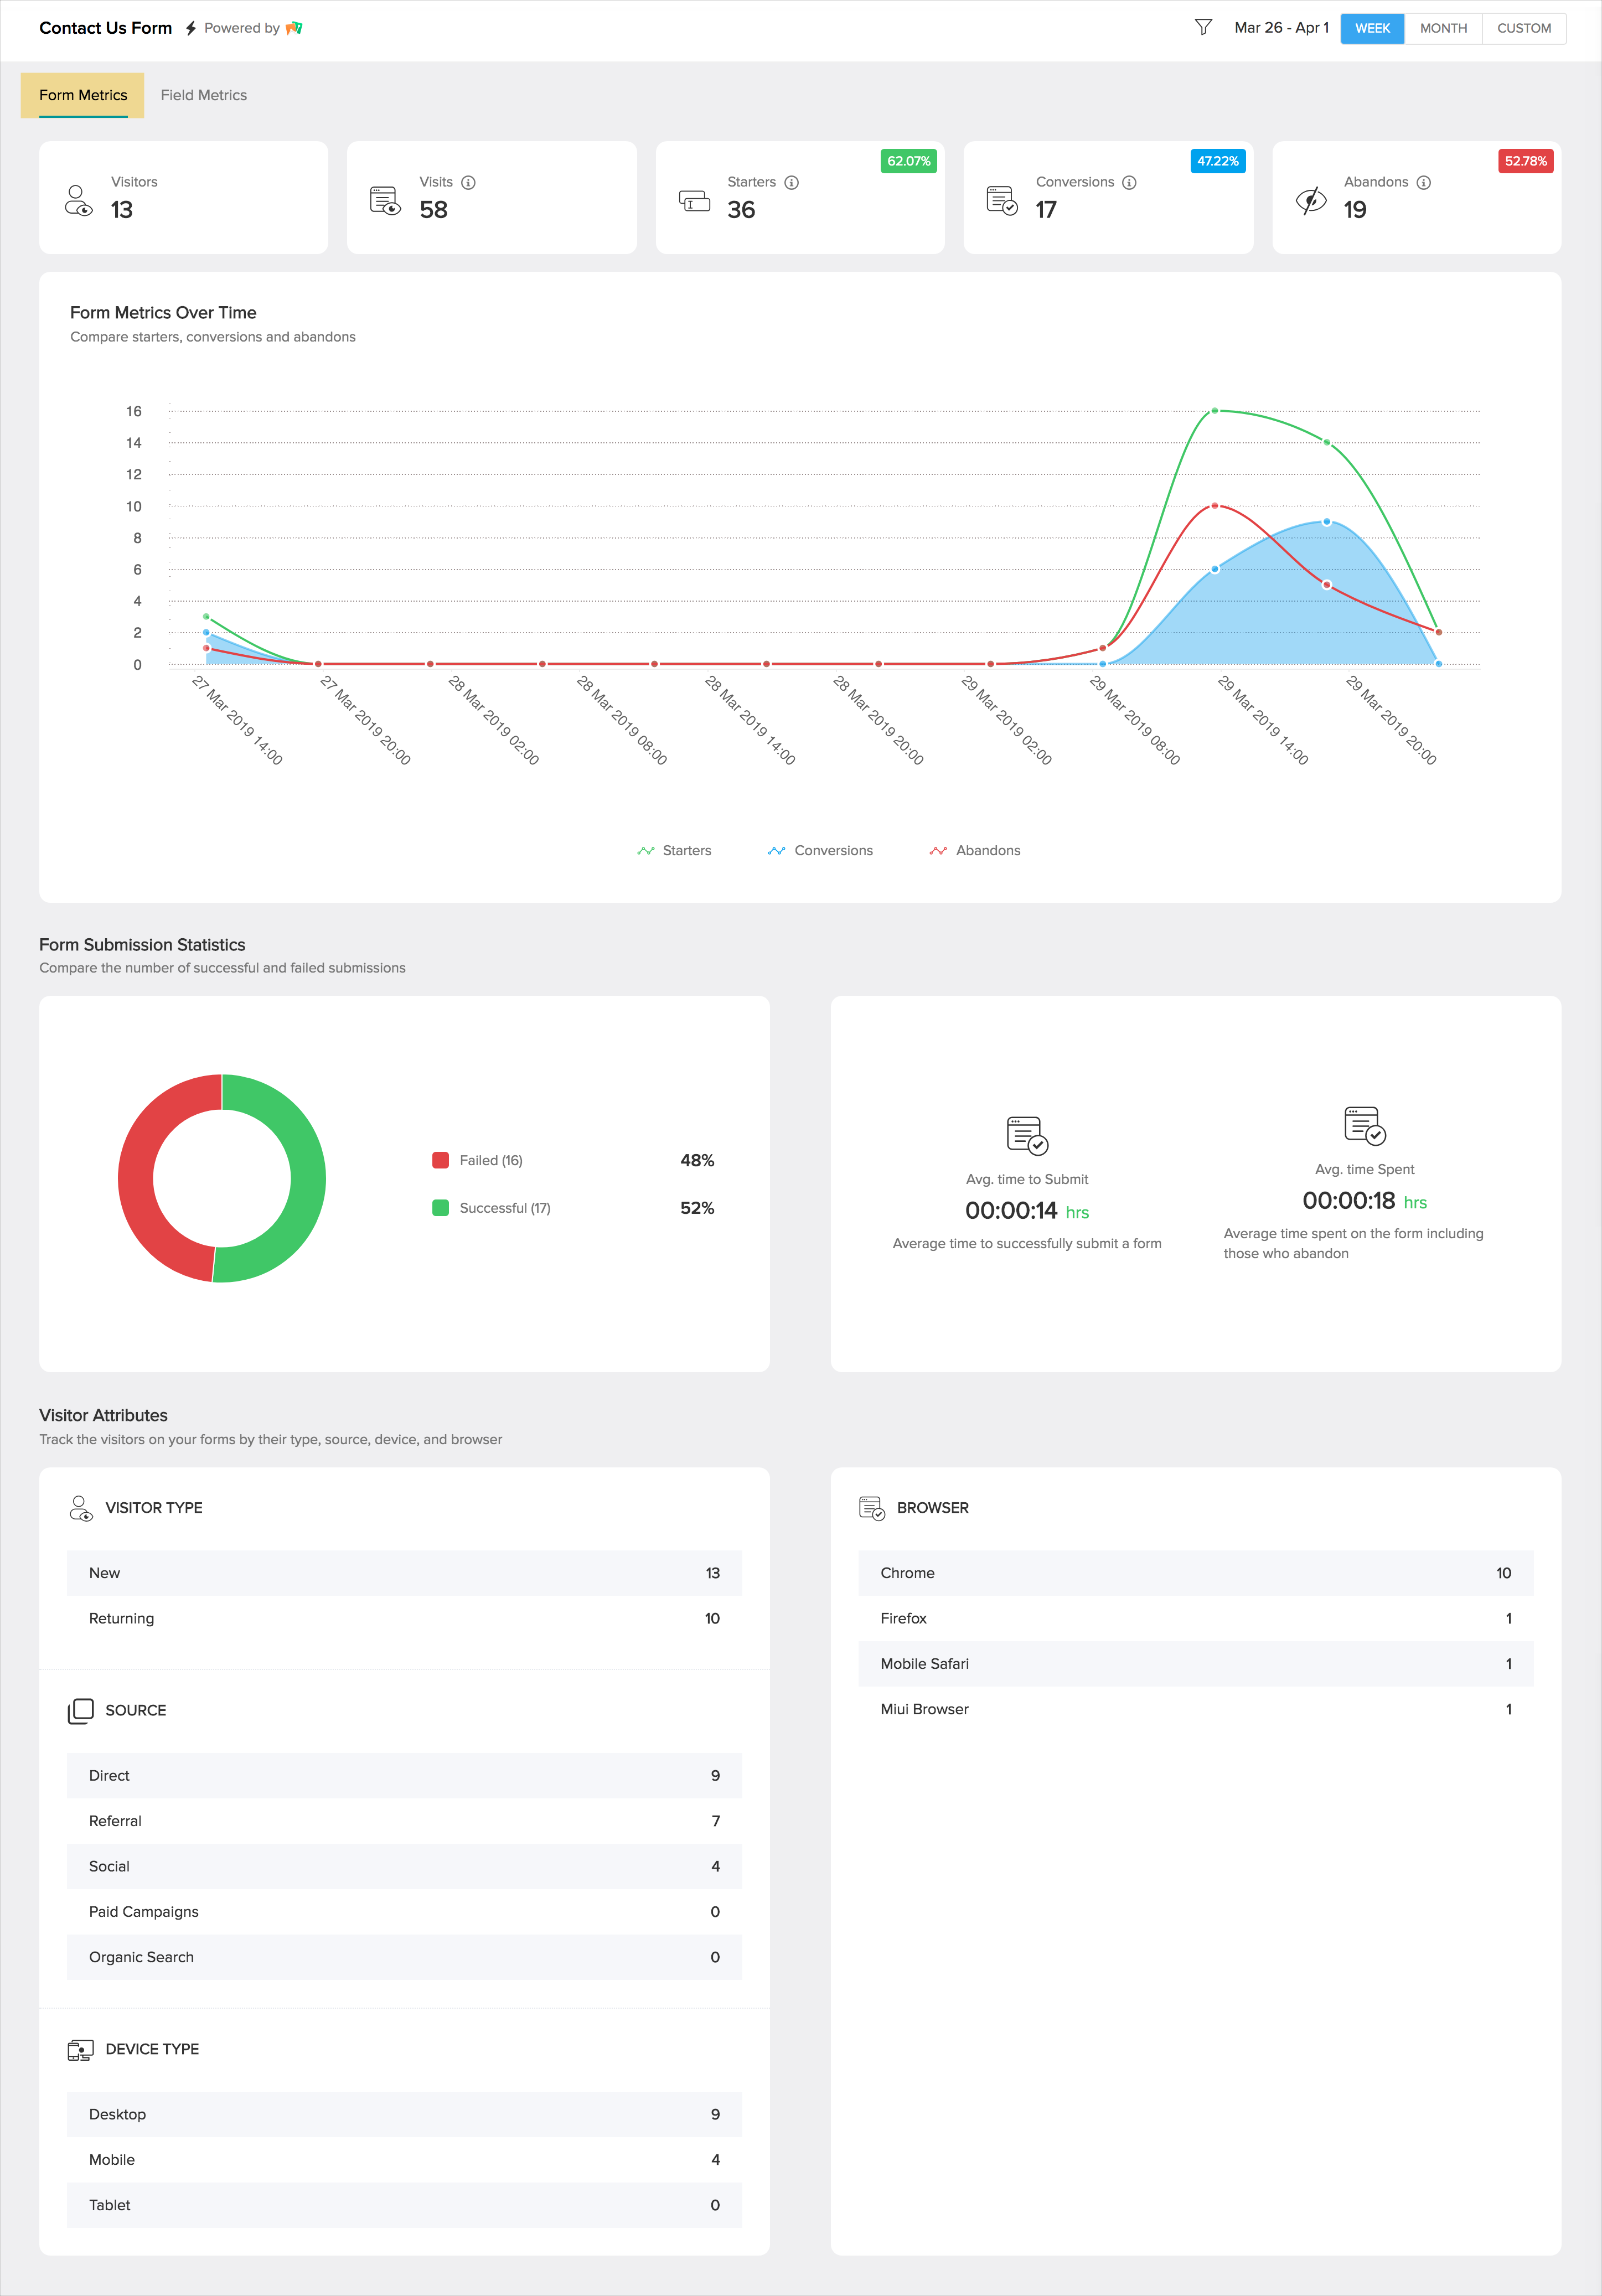
I. Form Basics
- Visitors: The number of unique visitors who've visited the form-contained web page at least once. The count is irrespective of whether or not interactions are made with the form.
- Visits: A visit is one individual visitor who reaches your website browses. The same visitor can visit the page multiple times.
- Starters: The number of visitors who've interacted with at least one field of the form.
- Conversions: The number of visitors that have submitted the form successfully.
- Abandons: The number of visitors that didn't submit the form after interacting with at least one field of the form.
II. Form Metrics Over Time
This widget provides a comparison of starters, conversions, and abandons count over time.
III. Form Submission Statistics
This widget provides a comparison of the number of failed and successful form submissions.
IV. Average Time to Submit
This widget displays the average amount of time it takes a visitor to submit the form successfully. It's calculated by dividing the total time spent on the form by visitors who have successfully submitted it by the number of successful submissions. Also, only converted users are considered in calculating this metric.
V. Average Time Spent
This widget displays the average time a visitor spends on the form. It is calculated by dividing the total time all the visitors who've interacted with at least one field of the form by the number of starters.
VI. Visitor Attributes
This widget will help you track visitors on your forms by their type, source, device, and browser.
Field Metrics
The field metrics dashboard explains everything about how your users interact with your form fields.
I. Field-level Statistics
This widget displays the following information:
- Focuses: The number of visitors who have clicked on the field.
- Interactions: The number of visitors who have entered information in the field.
- Refocuses: The number of visitors who have interacted with the field, navigated to a different section of the web page and then tapped or clicked the field again.
- Corrections: The number of visitors who refilled information in the field. Lowering the corrections will directly result in higher conversion rates.
- Drop-offs: The number of visitors who have stopped filling the form at each of the form fields. A high drop-off rate for a field may indicate that the information being asked is not entirely clear.
II. Filled and Blank Fields
This widget displays the number of visitors who have filled out the field, and of those who've left it blank.
III. Hesitation and Total Time
This widget displays the average time visitors had spent on the form, and the average time visitors spend hesitating before filling out the form. The hesitation time is calculated by finding the time difference between a visitor focusing on the field and entering information into the field.
Disabling Form Analytics
In some cases, it may be necessary to disable the Form Analytics and stop monitoring your forms. If so, follow the steps below:
- Click the Setup icon (
- In the Setup Landing page, click Web Forms under Channels.
- In the Feedback Widget page, toggle the Form Analytics option to OFF.
- Click Yes, Disable on the confirmation window.
Zoho PageSense now stops tracking the traffic on your existing forms. Consequently, the Form Analytics dashboards are also hidden in Zoho Desk.
Impact of Deleting/Disabling Forms
On disabling or deleting a form/widget, its corresponding PageSense experiment will be paused. You can enable a disabled form to continue tracking its visitors. Deleted forms are permanently delinked from PageSense, and you cannot relaunch their experiments.
Frequently Asked Questions
- What happens if I exceed the visitor count in my plan?
Running experiments will be paused, and you will receive an email notification if this should happen. You can relaunch experiments at the start of the next billing cycle. - Can I increase the number of visitors tracked?
Yes, at any time you like. You'll need to purchase a top-up plan in Zoho PageSense for the number of visitors you want to track. Top-up plan costs are listed below:
Related Articles
Tracking Goal Metrics using PageSense Integration
Many times you'll want to customize specific elements like an article details page, add ticket form, topic lists, or anything else visible on the help center theme. You might also want to edit it globally (on the entire help center) or only for ...Zoho Analytics for Projects
The Zoho Projects Advanced Analytics powered by Zoho Analytics, our online reporting & business intelligence service, allows you to slice and dice your projects data. Packed with 50+ ready made reports and dashboards that assist you in tracking and ...Google Analytics
With the help of site analytics, you can track the number of visitors to your website from your email campaign. Once you integrate your Google Analytics account with Zoho Campaigns, you can view all the analytics related information in Zoho Campaigns ...Webinar Analytics
Once your webinar is over, you can learn how effective it was using detailed analytical reports on registrations, attendee engagement, polls, and Q&A. You can also download and view responses by registrants if you had customized your webinar ...Enabling Google Analytics for your Help Center
Google Analytics is a free tool for analyzing the traffic of websites. It provides valuable insights on visitor trends and behavior. By knowing how your customers react and respond to your web pages, you can identify what works best, and what needs ...