Where can I find the dashboard to my survey and what is in it?
The dashboard, or the summary page, provides you with all the information regarding a particular survey in one place. It's arranged in such a way that there are quick access links to various functionalities of the survey from a single page.
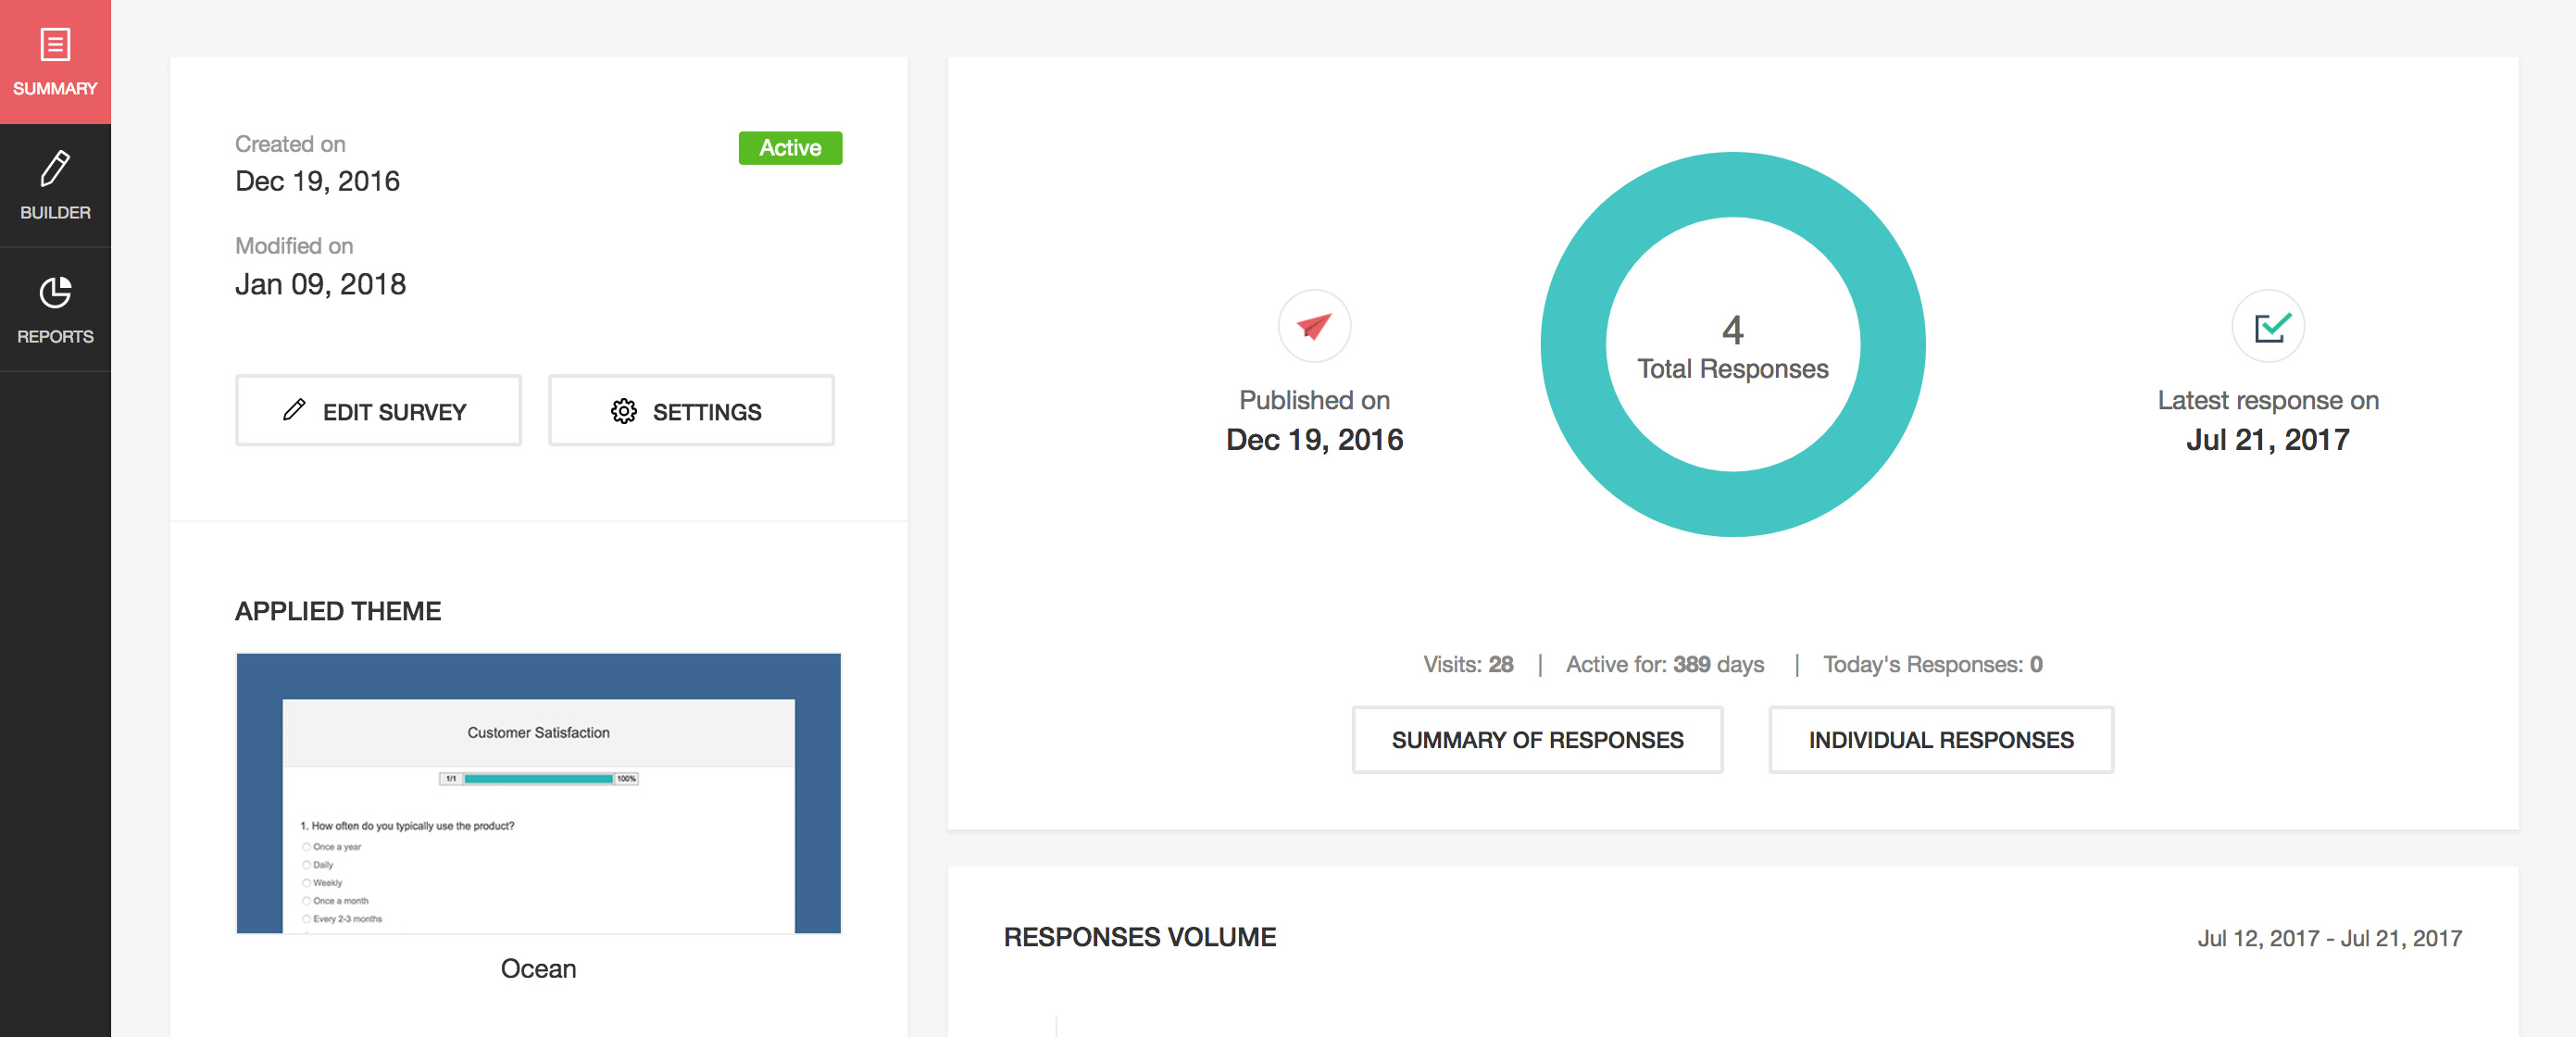
To get to the dashboard:
- Click any survey on the survey home page.
- Click Summary on the left pane.
Editor and Settings
The left side of the page displays details such as the created and modified dates of the survey. If your survey is active, you will see a green button that says 'Active'. This section also displays the current theme that has been used in your survey.
What can you do here?
- Click Edit survey to make necessary edits to your survey.
- Click Settings to make changes to the survey settings.
- Click Edit theme if you want to change the theme.
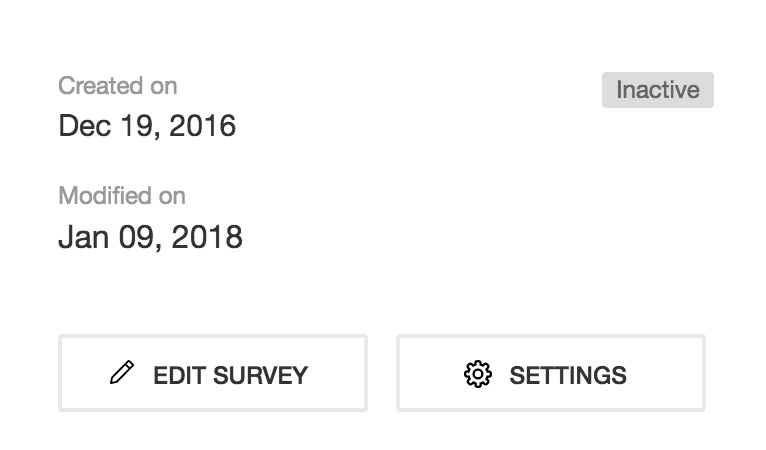
- If your survey has been closed to stop receiving responses, the status will show Inactive.
- If your survey has already been published, a section of the page talks about reports and responses.
Reports
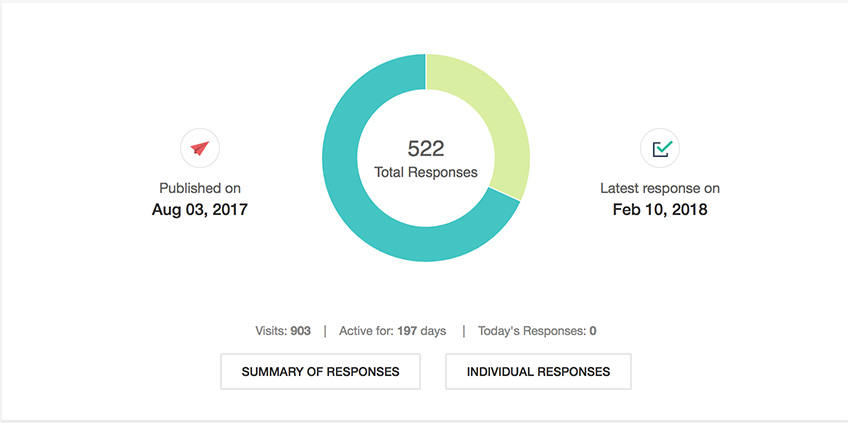
- Published on: The date the survey was published.
- Last Response on: The date you got the last response on.
- Total Responses: The total number of responses you have received so far.
- Visits: The total number of visits in your survey.
- Active for: The number of days since the survey has gone live.
- Today's Responses: The number of responses you have got on that particular day.
- Click Summary of Responses to see a summary of all the responses you have got so far.
- Click Individual Responses to take a look at the individual responses.
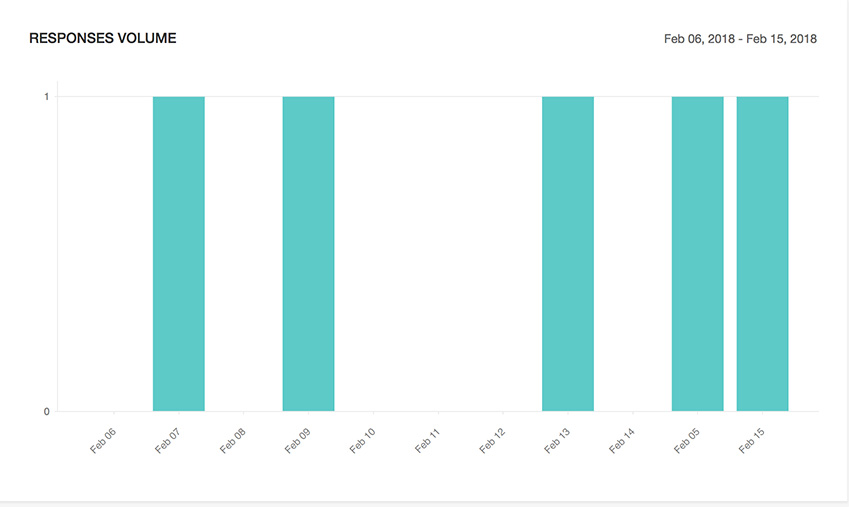
Responses Volume
You can find the volume of responses you have received during a particular period of time here.
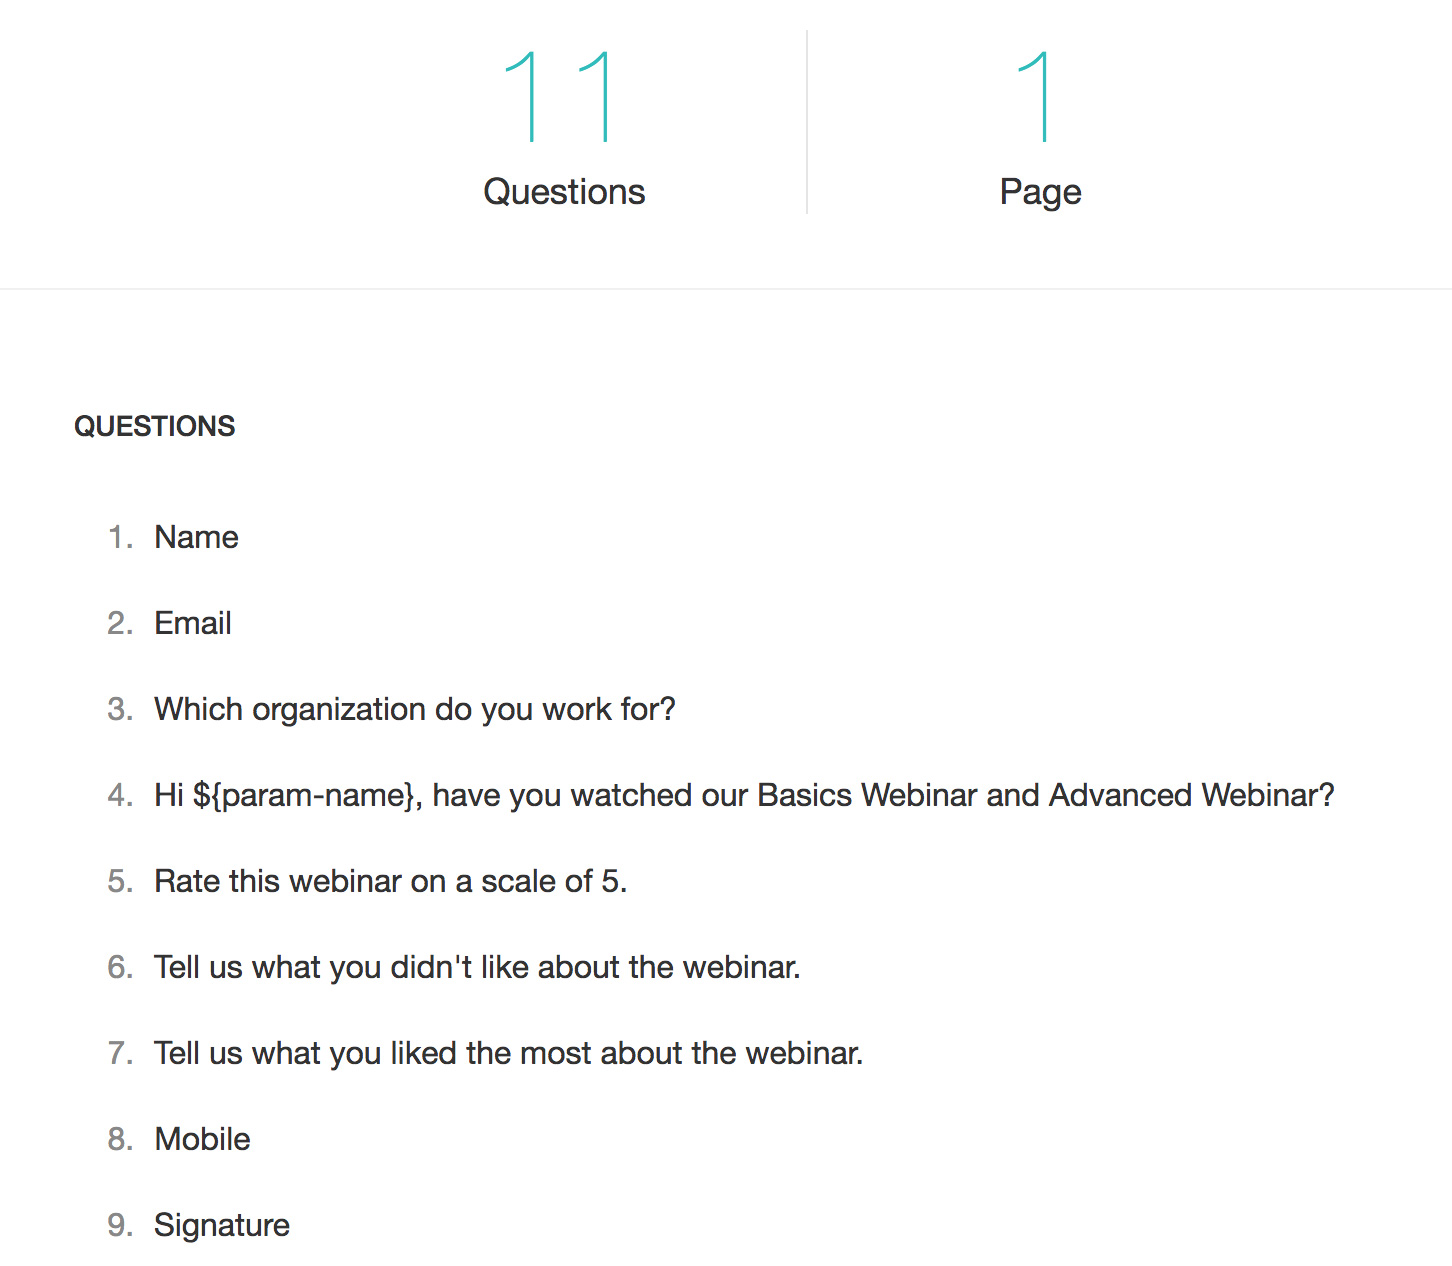
Questions
Scroll farther down to see the number of questions and pages your survey has in total. If you have yet to add any questions in your survey, click Add your first question to begin.
Survey URL
The next section displays the live form URL of your survey. Click Access to take a look at it.
There are also options to share your survey on various social media platforms.
- Click
 to share your survey on Facebook.
 - Click
 to share your survey on Twitter.
 - Click
 to share your survey on LinkedIn.
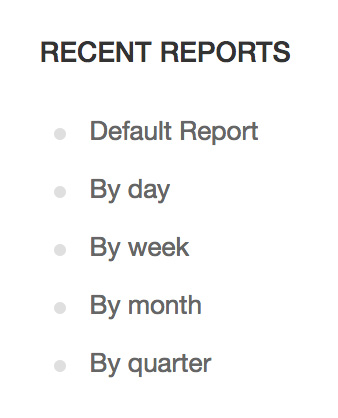
Recent Reports
- Click Default Report to go to the reports page.
- Click By day to take a look at day to day reports.
- Click By week to view week wise reports.
- Click By month to view monthly reports.
- Click By quarter to view quarter wise reports.
Collaborators
This section displays the list of collaborators who have access to your survey. If you have yet to add any collaborators, click Share to add collaborators to your survey.

Related Articles
Dashboard
The dashboard, or the summary page, provides you with all the information regarding a particular survey in one place. It's arranged in such a way that there are quick access links to various functionalities of the survey from a single page. How do I ...How do I view an individual response to my survey in Zoho Campaigns?
After you successfully launch a campaign, you can access the survey reports of each respondent in the email list. To view individual responses: Select an email campaign from all the campaigns you have sent from the Zoho Campaigns home page. ...Understanding the Dashboard
When you log in to your Zoho Campaigns account, the first screen you'll see is the Dashboard. The dashboard gives you an overall summary of your account activity in an easily digestible way. In this section, we’ll take you through different aspects ...Where can I find the individual responses to my survey?
In this section, you'll find details about individual responses for each of your survey questions. The respondent's IP address, the date, and the time they took to complete the survey and the average rating of the survey will also be displayed. ...Where do I find the current theme of my survey?
Play around with your survey's fonts, background, and colors. With our themes, you can change the look and feel as much as you like. Align it with your brand's image to give it a professional look. You can find your current theme on navigating to ...
