Zoho Analytics for Projects
The Zoho Projects Advanced Analytics powered by Zoho Analytics, our online reporting & business intelligence service, allows you to slice and dice your projects data. Packed with 50+ ready made reports and dashboards that assist you in tracking and enhancing your project deliverables. You can also create your own ad hoc reports to analyze your projects data the way you want. You can view and share reports with your team members to enable collaborative analysis of your project information.
Click to learn more on access privileges for Zoho Apps integration.

- The Reports tab in Admin section is enabled only in the Premium and Enterprise paid plans.
- The connector is available in all paid plans of Zoho Analytics.
- The custom fields and custom statuses for tasks can also be viewed in Zoho Analytics from now on.
Get to know more about Sharing and Collaboration in Zoho Analytics at https://www.zoho.com/analytics/help/sharing/
Activate Zoho Analytics Add-on
You can configure any numbers of projects as desired to view and track the project progress with multiple report views.
- Navigate to Global Setup > Integrations > Zoho Apps > Zoho Analytics.
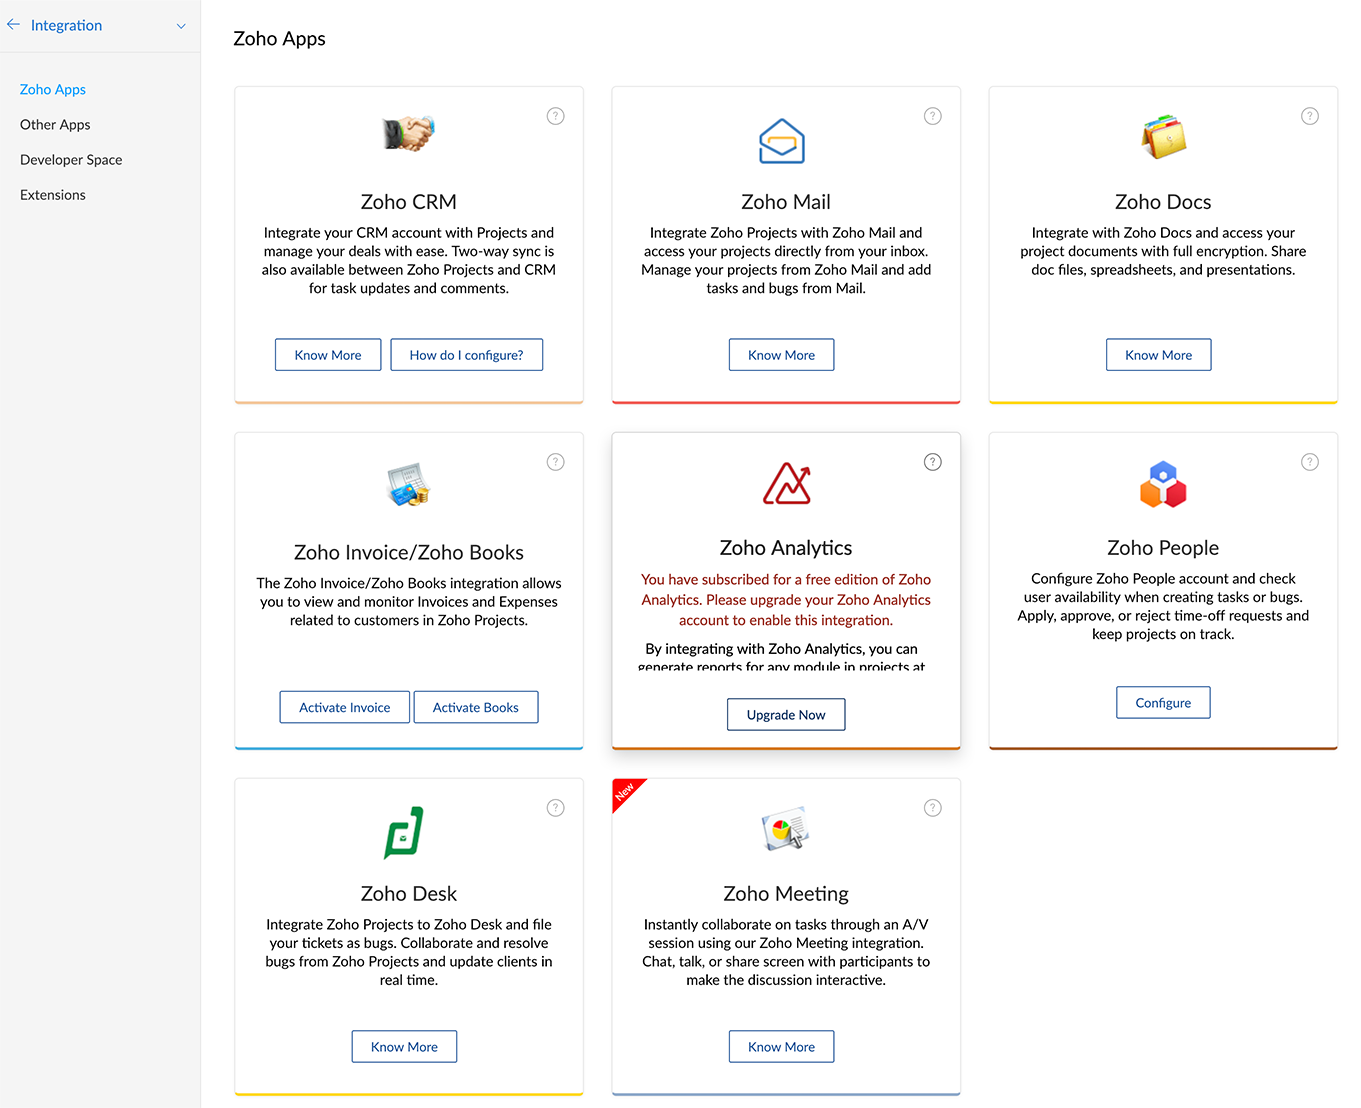
- Click Configure.
- Select the desired projects.
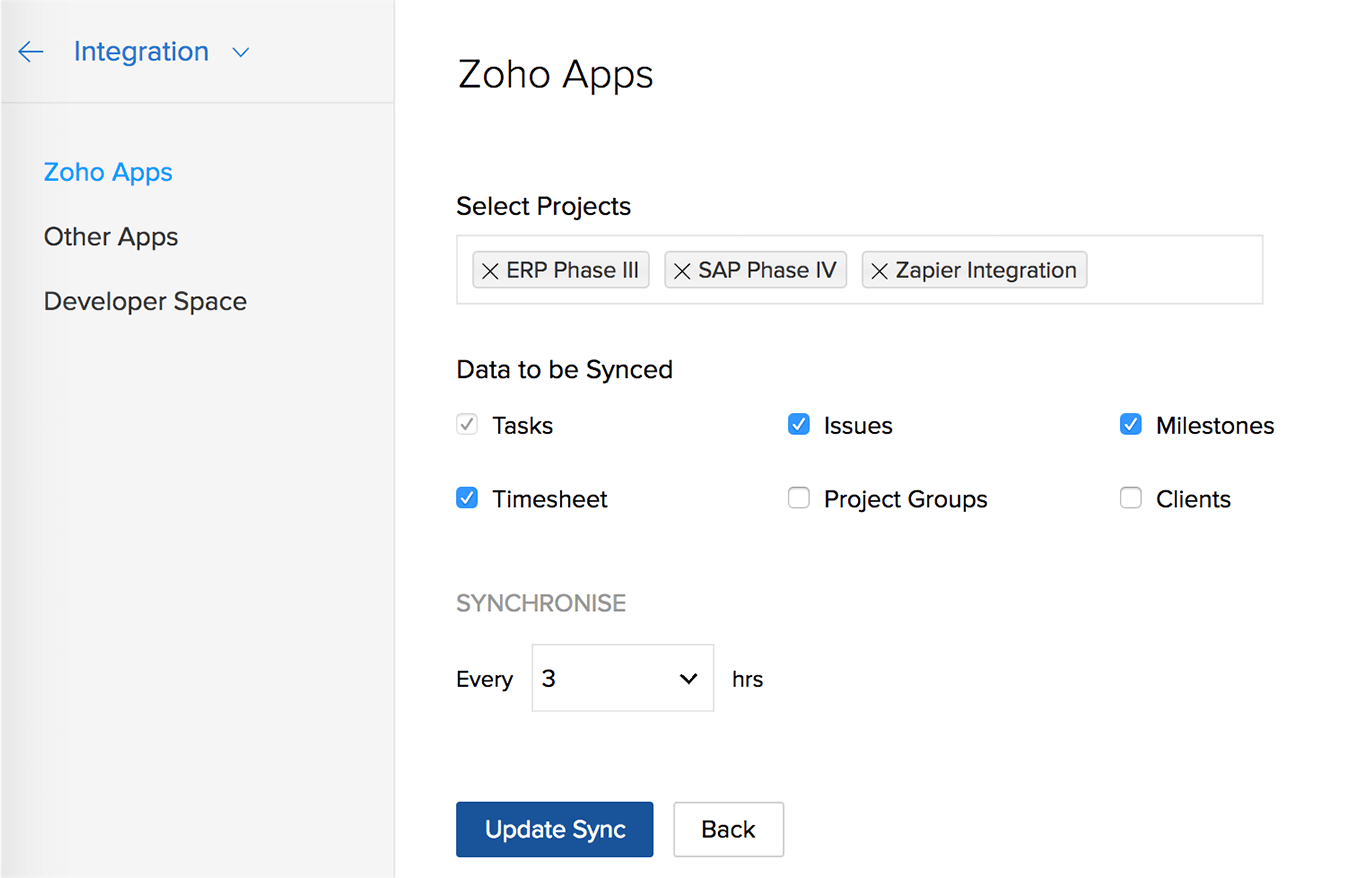
- Select the required data options to sync with Zoho Analytics.
- Select the sync frequenct. You can schedule the frequency to synchronise data every 3, 6, 12, and 24 hrs.
- Click Update Sync to sync the chosen project's data.
A notification mail is sent to you after the project(s) data is synced successfully with Zoho Analytics. Once the sync is completed, you can start accessing the default reports created and create your own reports & dashboards on your projects data.
View Project Reports
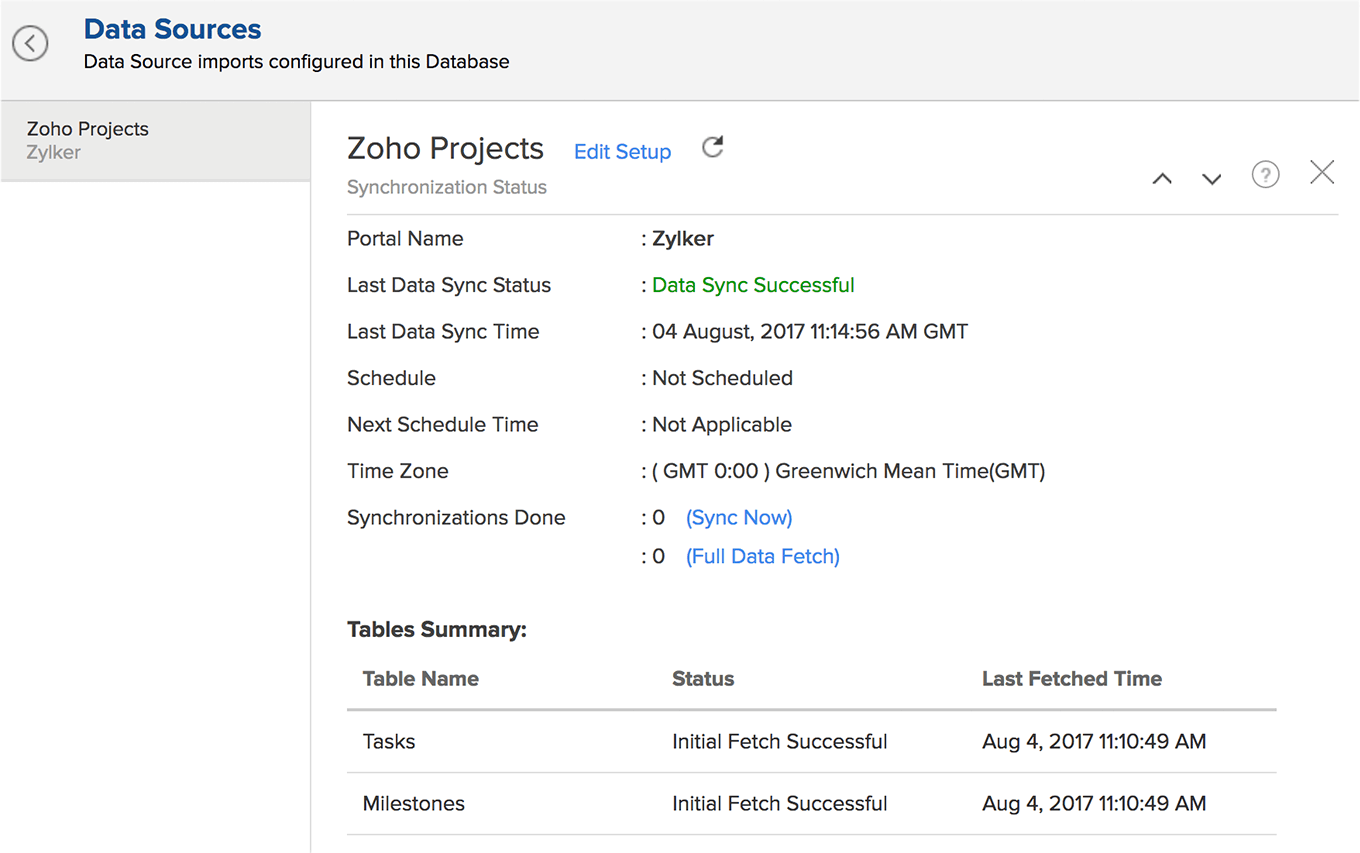
You can view the project reports only after the project data is synchronized into Zoho Analytics and see different types of reports for each module.You will be directed to Zoho Analytics reporting workspace setup for this portal. There can be only one reporting workspace setup for a portal.
A message about the synchronization status, is displayed if the synchronization is in progress. You can also try to reload the Zoho Analytics page after sometime.
- In Zoho Analytics, expand any desired module to display its various report views.
- You can access the data from different projects module by expanding the "Zoho Projects Modules (data)" folder. And you can access the default reports & dashboards created, by expanding other folders listed.
- You can access the data from different projects module by expanding the "Zoho Projects Modules (data)" folder. And you can access the default reports & dashboards created, by expanding other folders listed.
- Select any desired report to view its data.
Default Reports Created
Project and Milestone Reports
By default 50+ insightful reports & dashboards are created. The reports are grouped based on module & functionality under different folders. You can view a range of project and milestone based reports capturing useful metrics such as current status of each project in the portal, tasks that are pending in each milestone, Planned vs Actual Time Spent, Target Milestones vs Actual Completed, Top 5 Delayed Open Milestones and so on. You can click on any of the report to view them. You can also edit the default report, if required.
- Active Milestones by Project User: Active milestones of each users.
- Delayed Open Milestones: All delayed milestones along with open tasks and percentage.
- Milestones Completed Trend by Users: Number of milestones completed by each owner every month.
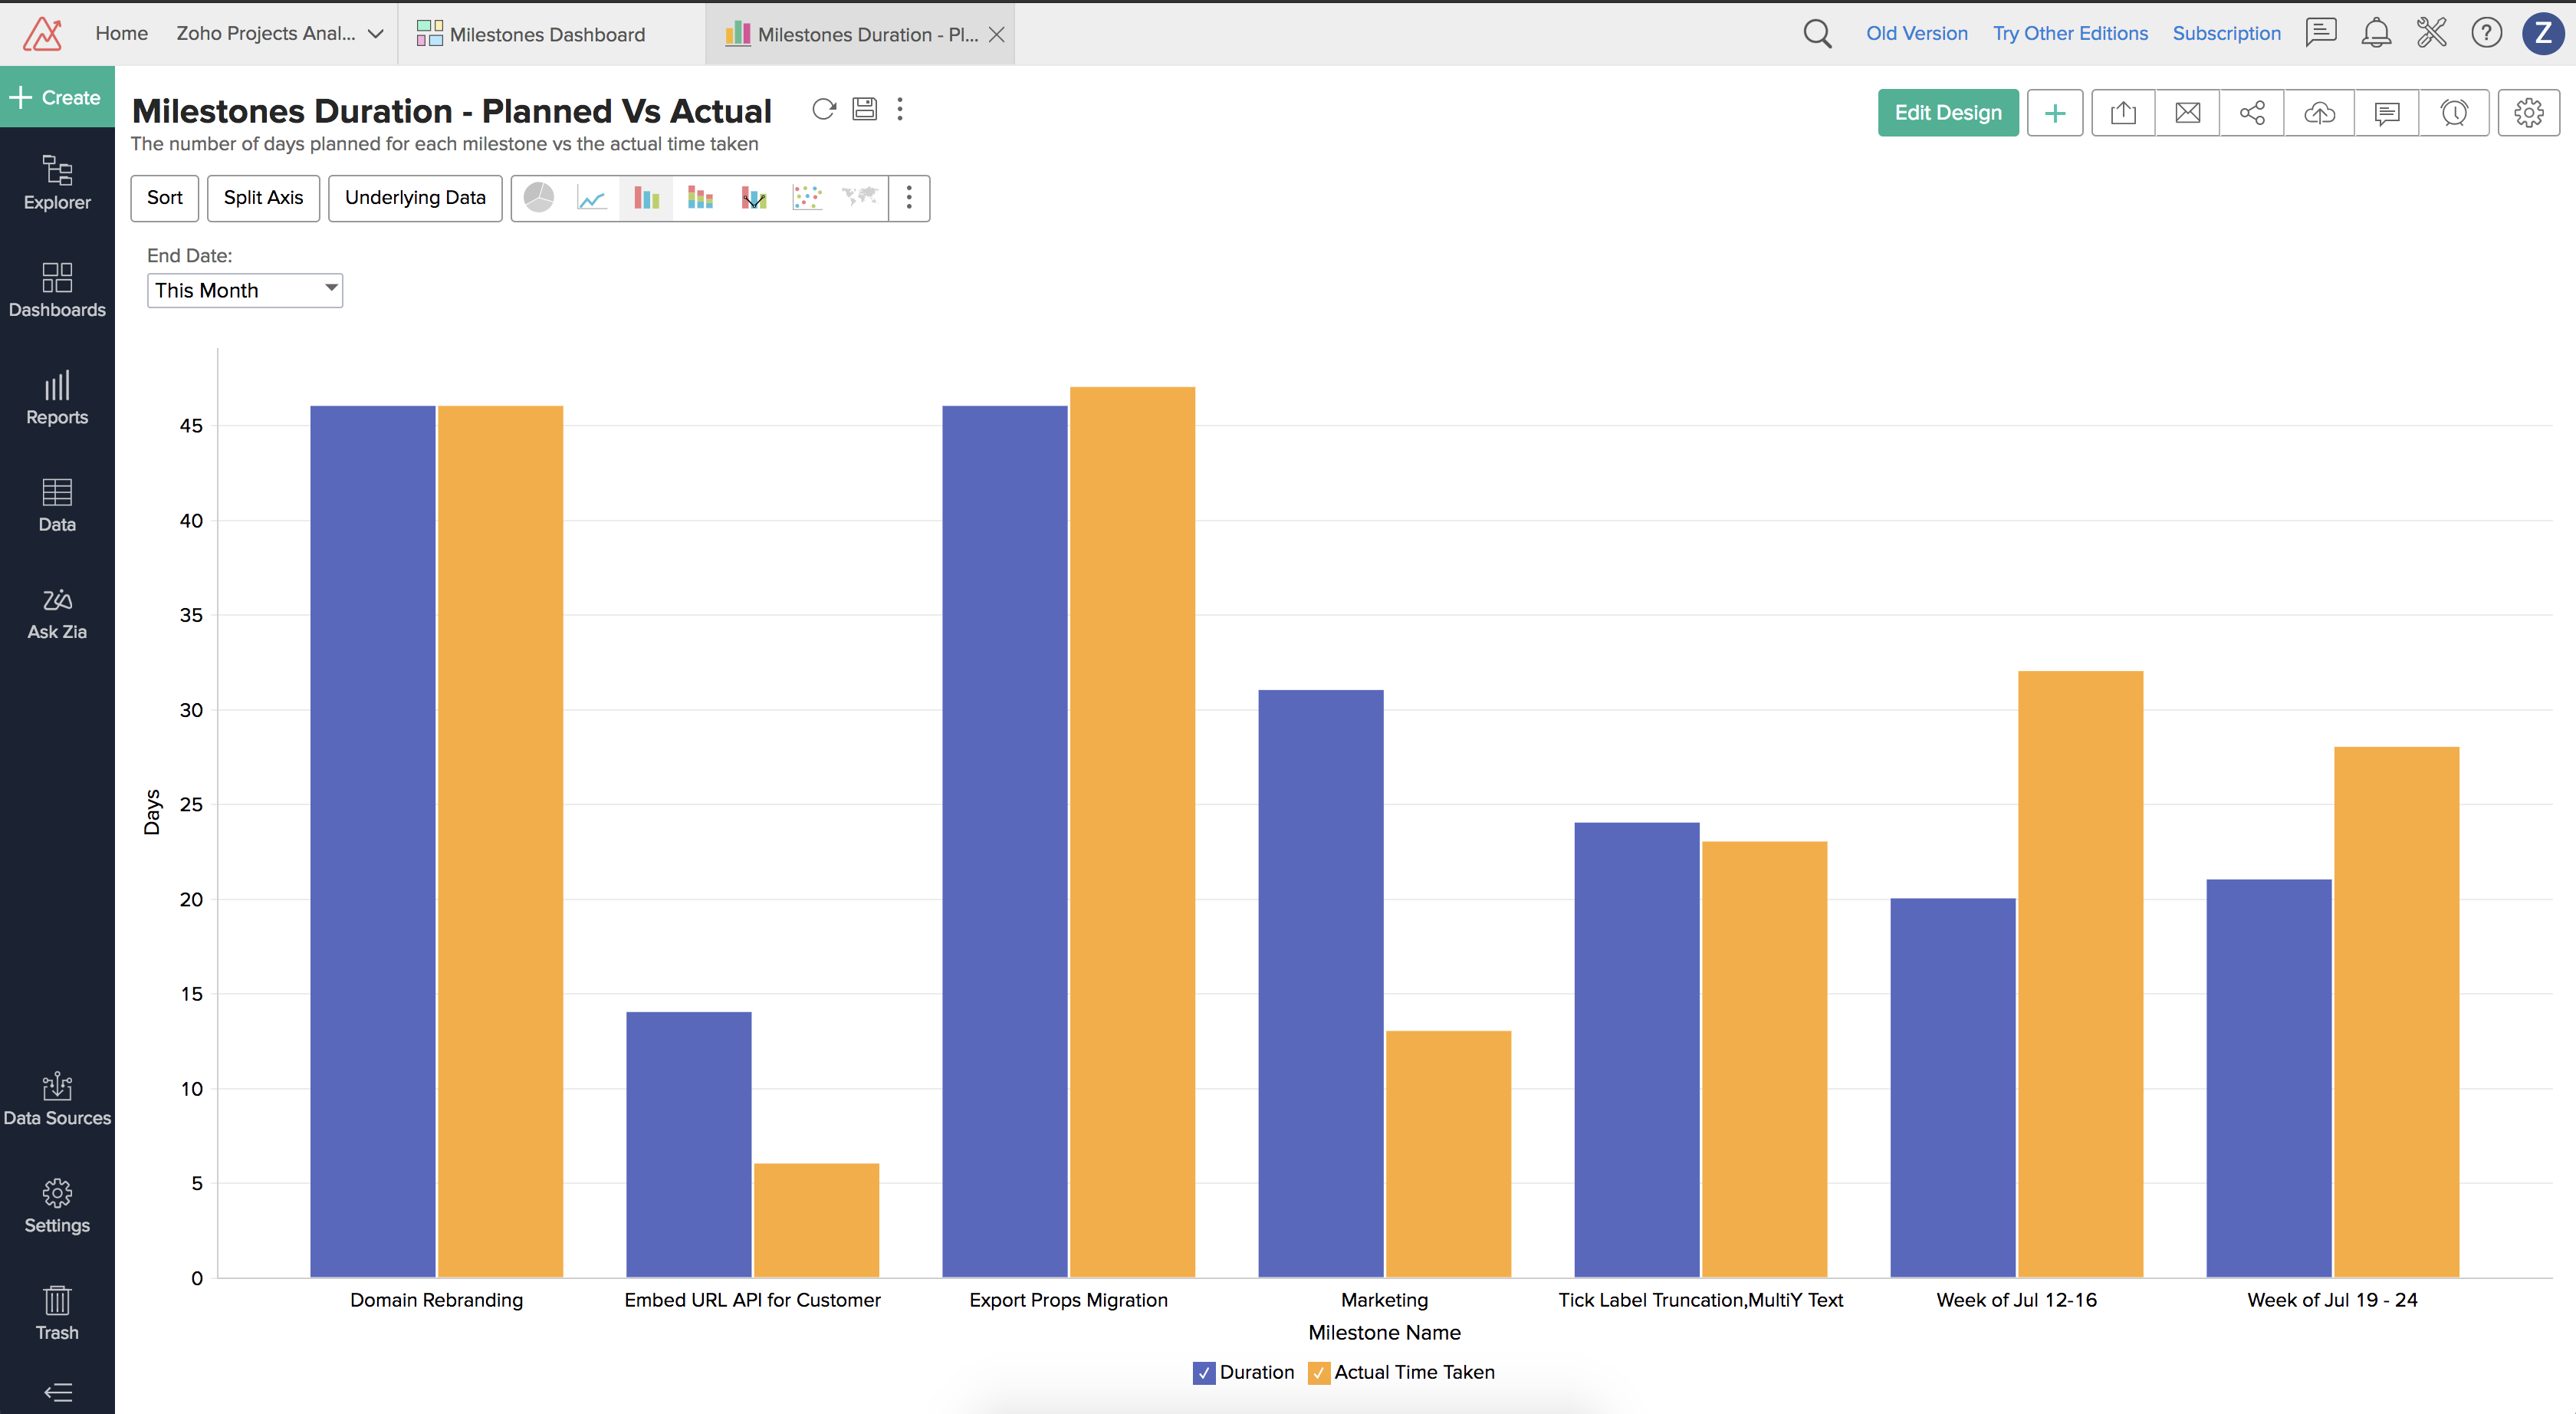
- Milestones Duration - Planned Vs Actual: The number of planned days vs the actual time taken for each milestone.

- Milestones On-time Vs Delayed- Last 3 months: Milestones that are on-time and milestones that have been delayed.
- Overdue Milestones Age: Age of overdue milestone.
- Pending Tasks across Open Milestones: Tasks that are pending in each milestone.
- Project Status Overview: Current status of each project in the portal.
- Project- Planned vs Actual Time Spent: Actual duration planned vs actual time spent in the project. This reports is based on tasks.
- Slowest Milestones: The scheduled variance of the top 10 slowest milestones.
- Target Milestones vs Actual Completed each month: Total milestones to be completed each month vs actually completed milestones.
- Tasks Status across all Milestones: Status of tasks across all defined milestones.
- Top 5 Delayed Open Milestones: Top 5 most delayed open milestones.
- User-wise Milestone Completion - On-time vs Late: Milestones completion status based on its users.
Task Reports
You can view task reports based on various criteria such as task status in each project, total number of tasks completed by its owners month-wise. You can click on any of the views to display its data based on your requirement.
- Bottom 5 Members with Least Tasks Closed - Last 3 Months: Bottom 5 members, based on the lowest number of tasks closed in the last 3 months.
- Members with No New Tasks Assigned - Last 30 days: Project members with no new task assigned in the last 30 days.
- Project-wise Tasks Status: Task status in each project.
- Tasks Addition Trend: Number of tasks assigned each month.
- Tasks Completed so far by Owners: Total number of tasks completed by its owners month-wise.
- Tasks Completed vs Target by Month: Number of tasks completed every month.
- Tasks Overdue by Owners: Number of overdue tasks along with its overdue days and percentage of overdue and its owners.
- Tasks Progress by Owners: Tasks in progress and its owners.
- This Month - Tasks to be Closed: Tasks to be closed in the current month along with its closed percentage and count of closed tasks.
- Top 10 Delayed Tasks: Top 10 most delayed overdue tasks.
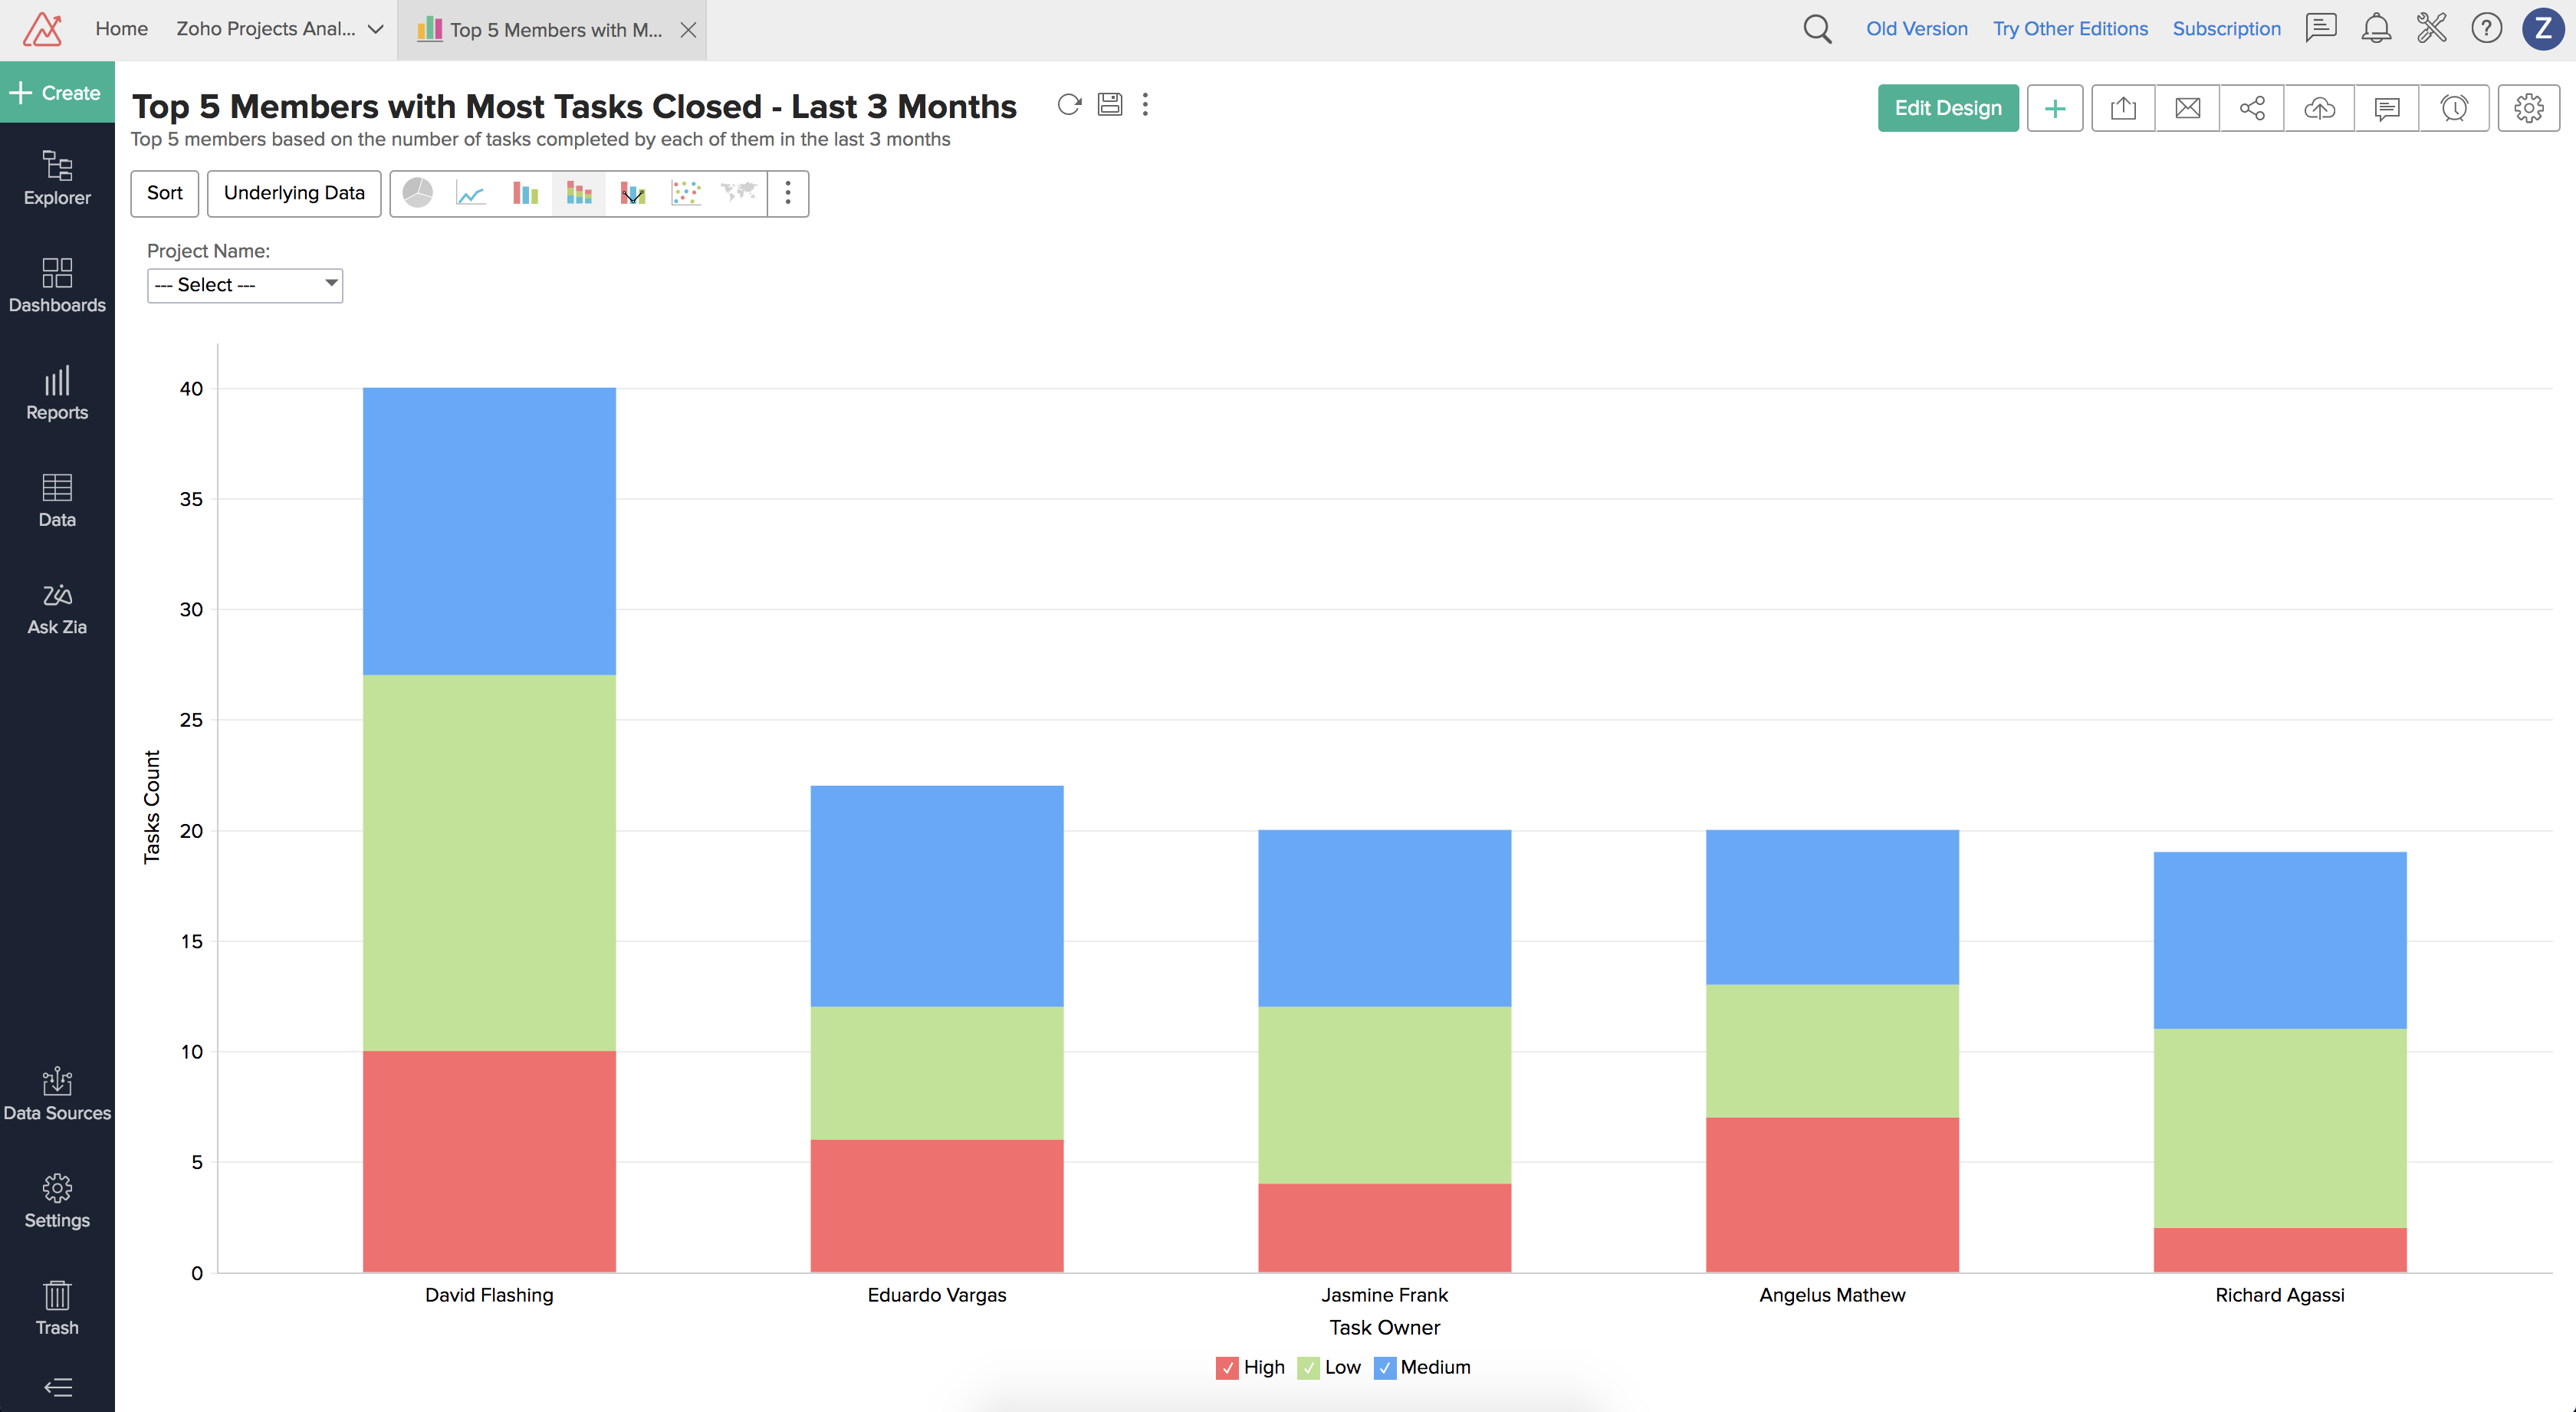
- Top 5 Members with Most Tasks Closed- Last 3 Months: Numbers of tasks completed by the top 5 members in the last 3 months.
Timesheet Reports
You can view the timesheet report based on the billing hours such as billable and non-billable hours logged for the projects, timesheet report based on projects and so on. You can click on any of the views to display its data based on your requirement.
- Average Billable Hours by Project - Last 12 Months: Average billable hours logged in a day for the corresponding projects in the last 12 months.
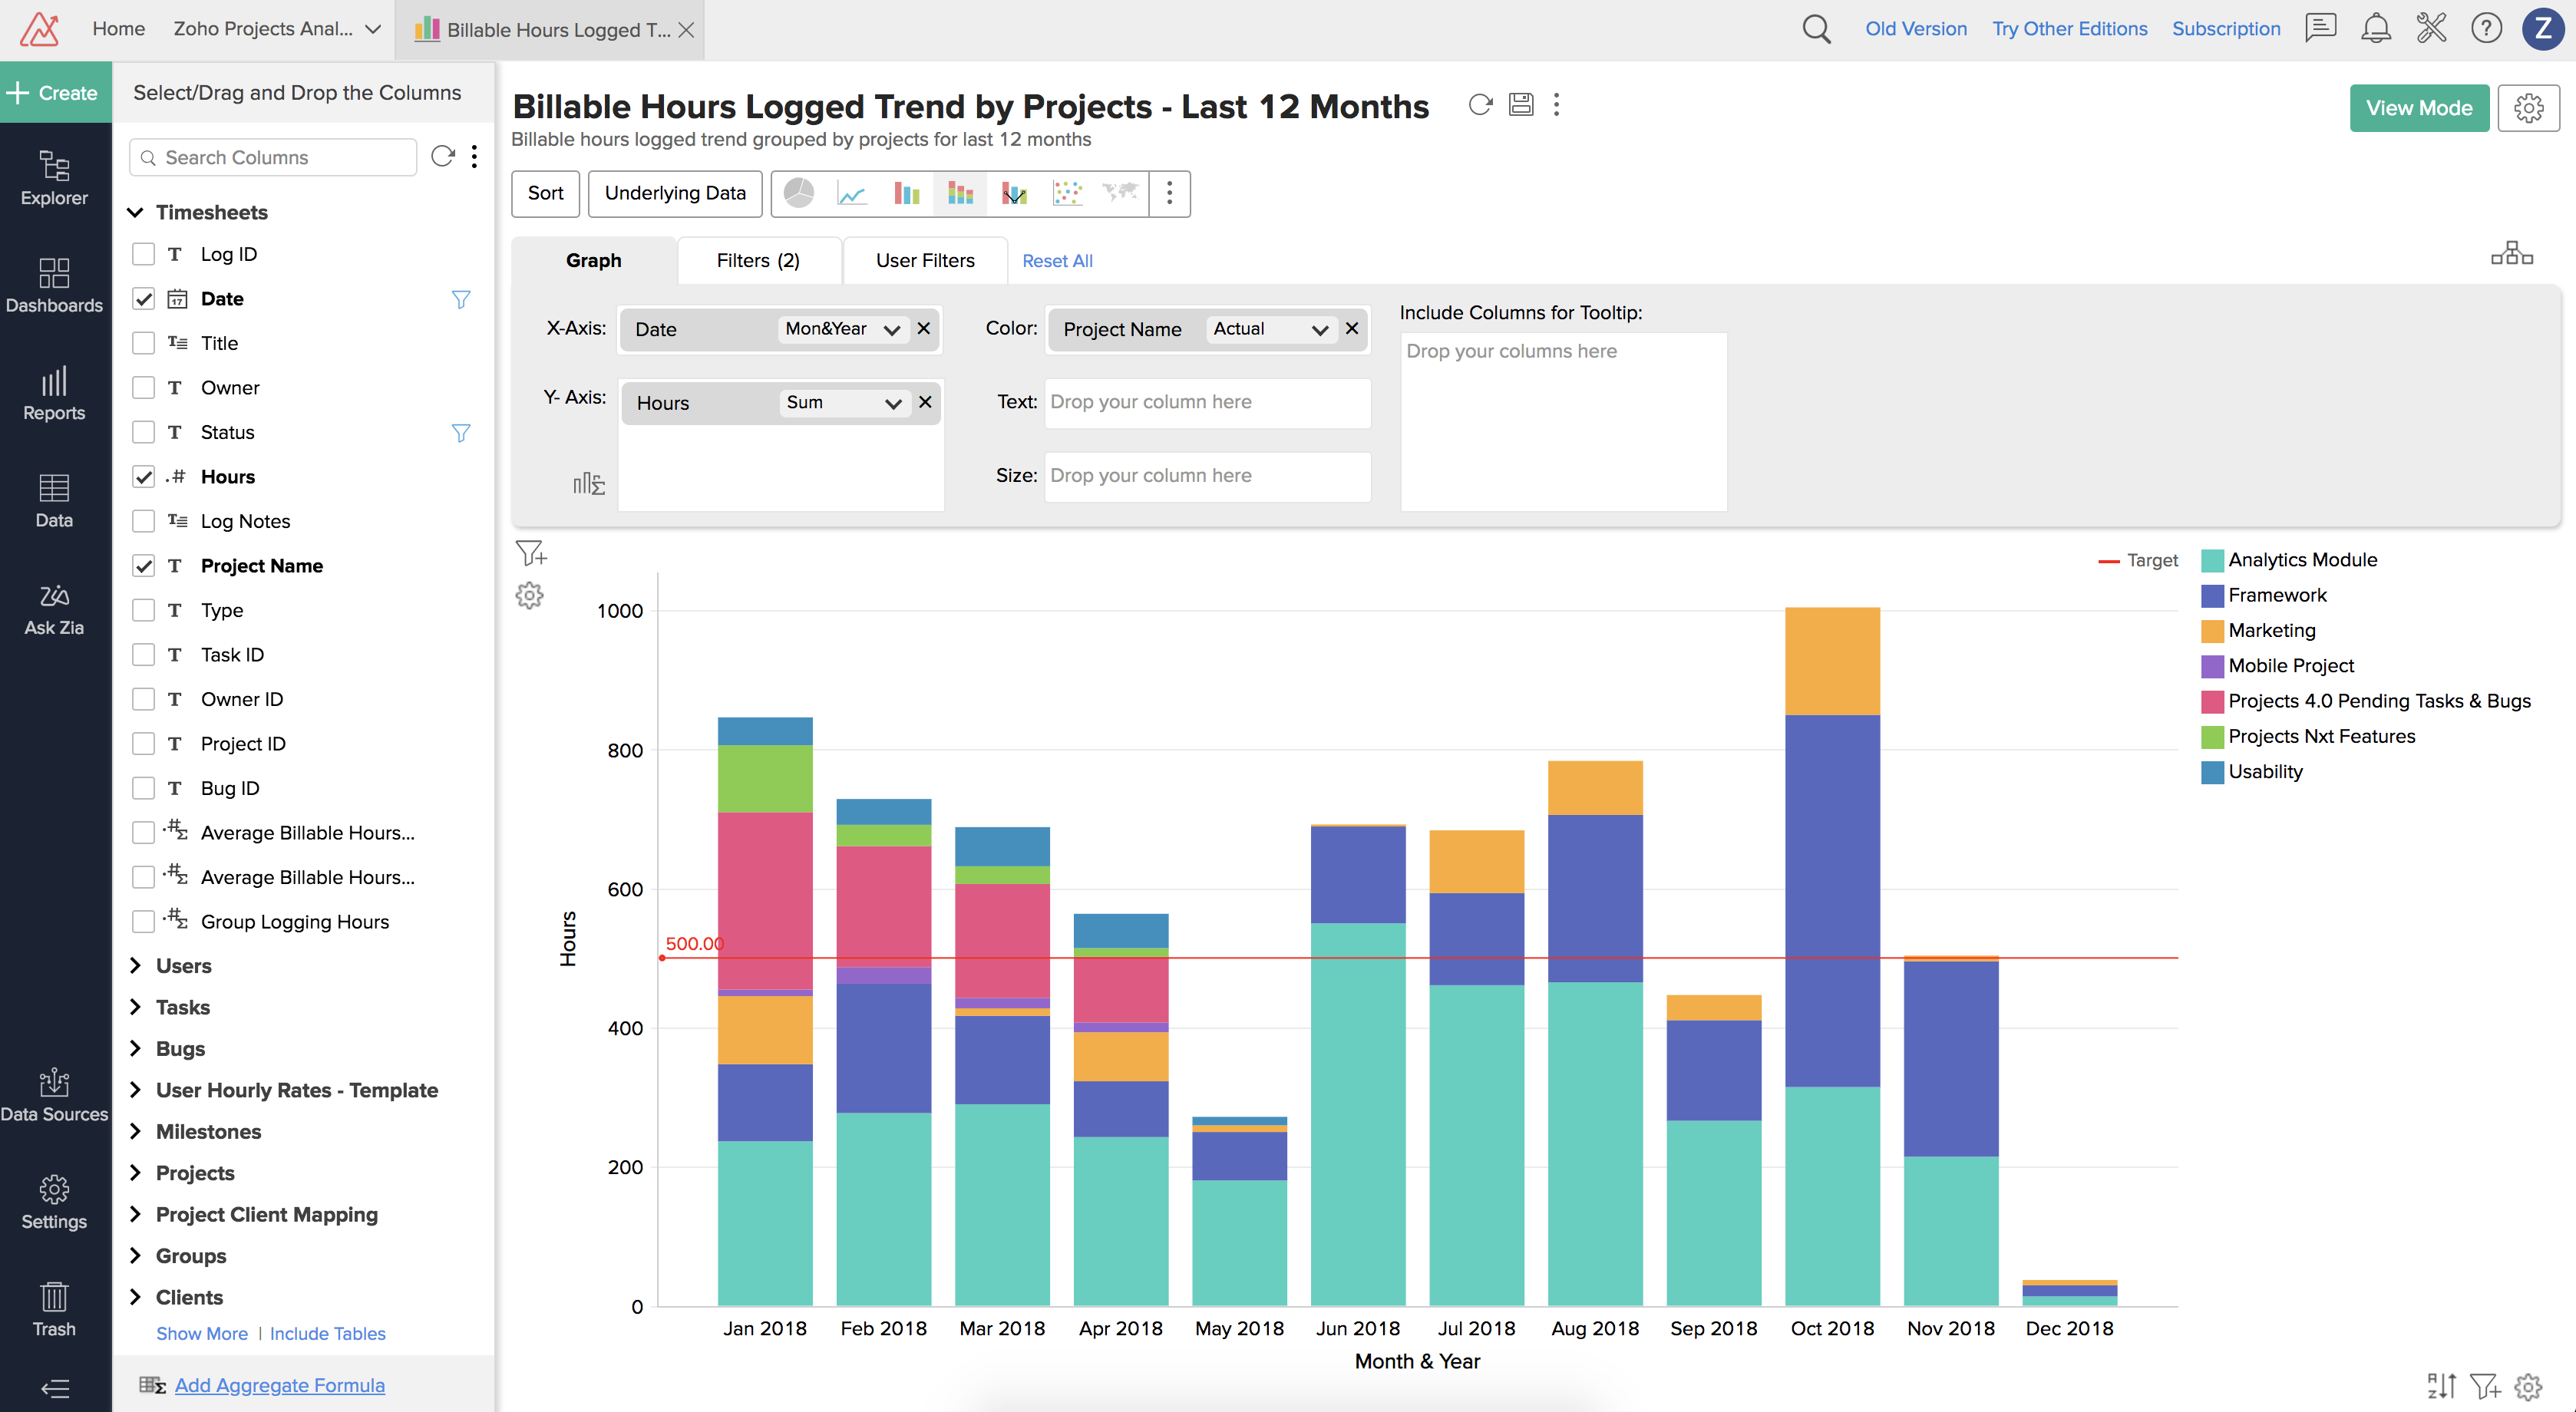
- Billable Hours Logged Trend by Projects - Last 12 Months: Trend of billable hours logged for the corresponding projects in the last 12 months.
- Billable vs Non-Billable hours by Project: Billable vs Non-Billable hours logged for the corresponding project.
- Bottom 5 Project Members by Billable Hours: Bottom 5 members across projects vs the billable hours.
- Effective ROI of Projects by Billable Hours: Effective ROI of each project vs the average billable hours logged.
- Timesheet by Projects and Members: Timesheet report based on projects, users and billable hours.
- Timesheet Hours Logged by Users - Last 6 Months: Total hours logged by each user in the last 6 months.
- Timesheet Hours Logged Trend - Last 12 Months: Trend of logged hours vs months in the last 12 months.
- Timesheet Hours Logged Trend - Last 30 days: Trend of logged hours vs months in the last 30 days.
- Top 5 Project Members by Billable Hours: Top 5 project members and their billable hours across projects.
- Top Projects by Billable Hours: Top projects and their total billable hours logged.
Members / User Reports
You can view users report based on various criteria such as milestone completion status for each user, task status for each user and so on. You can click on any of the views to display its data based on your requirement.
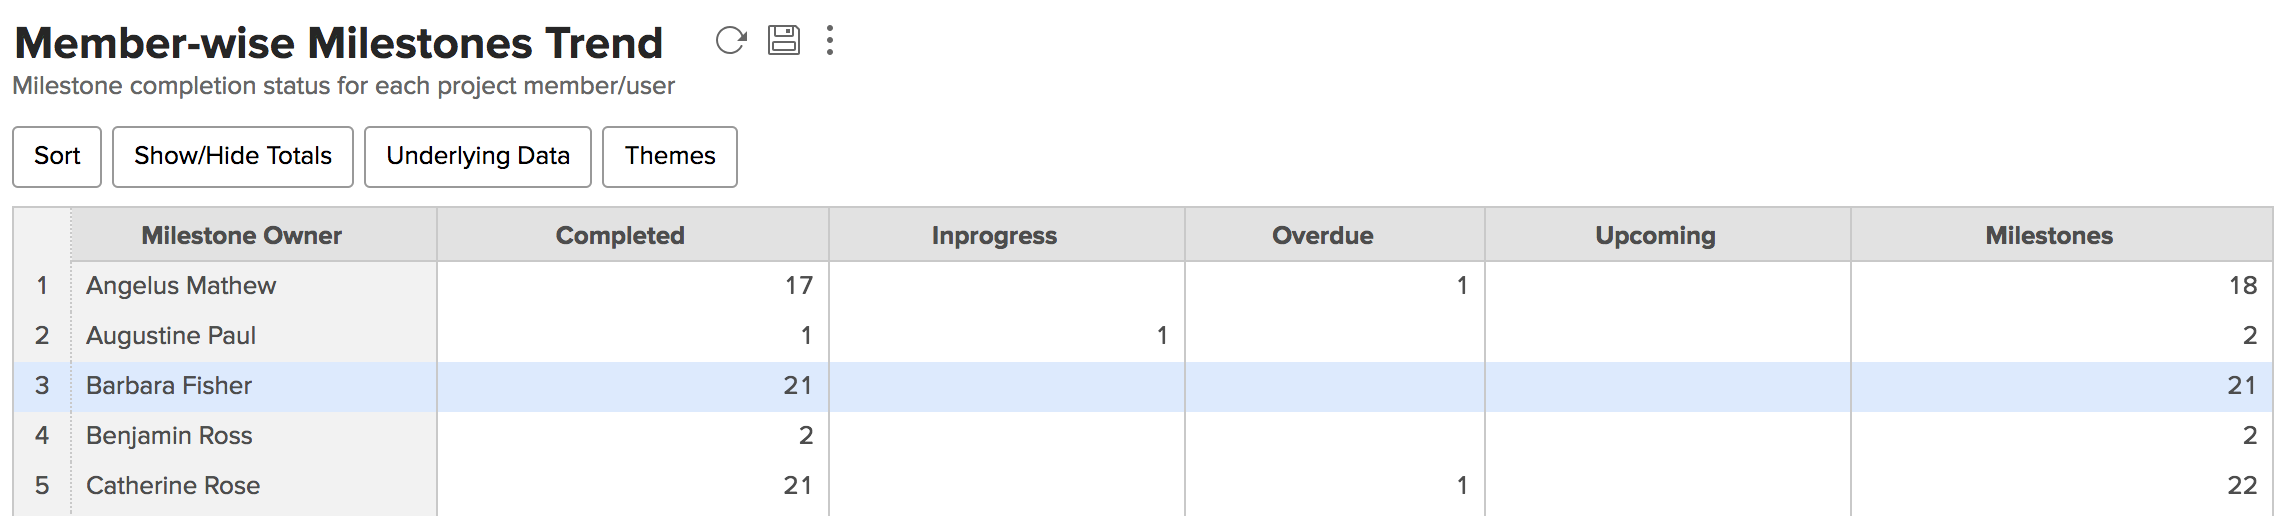
- Member-wise Milestones Trend: Milestone completion status for each user.
- Member-wise Tasks Completion Status: Task completion status for each user.
- Member-wise Tasks Status: Task status for each user.
Billing Reports
You can view billing reports based on various criteria. You can use billing reports to find out details such as revenue generated per project member for each project, top 10 members based on their billed hours and so on. You can click on any of the views to display its data based on your requirement.
- Billing charges: Billing report for members, projects, billable amount and so on.
- Bottom 10 Billed Members: Bottom 10 billed members and their billable hours.
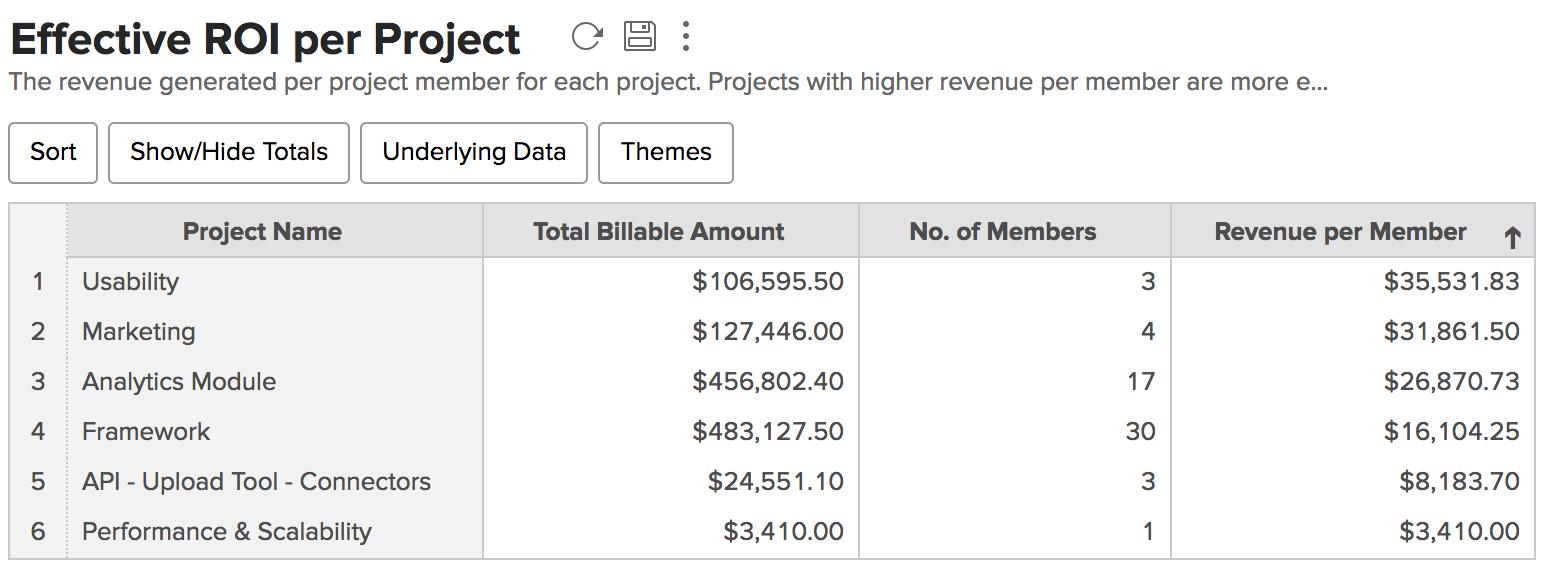
- Effective ROI per Project: Revenue generated per project member for each projects.
- Projected Revenue: Projected revenue for the coming months based on the number of hours to be billed.
- Projected Revenue Calculation Table: Calculation table for projected revenue.
- Projects Revenue This Quarter: Revenue of each project based on their billed hours.
- Top 10 Billed Members: Top 10 members based on the billed hours.
- User Hourly Rates-Templates: Template for members and their hourly rates.
Burndown Reports
You can view burndown reports based on various criteria. Burndown reports are used to find the difference between the projected figures and its variance in project management. You can click on any of the views to display its data based on your requirement.
- Burn Down Milestone Entry Table - Template: Template table for milestone burn down report.
- Burn Down Projects Entry Table - Template: Template table for projects burn down report.
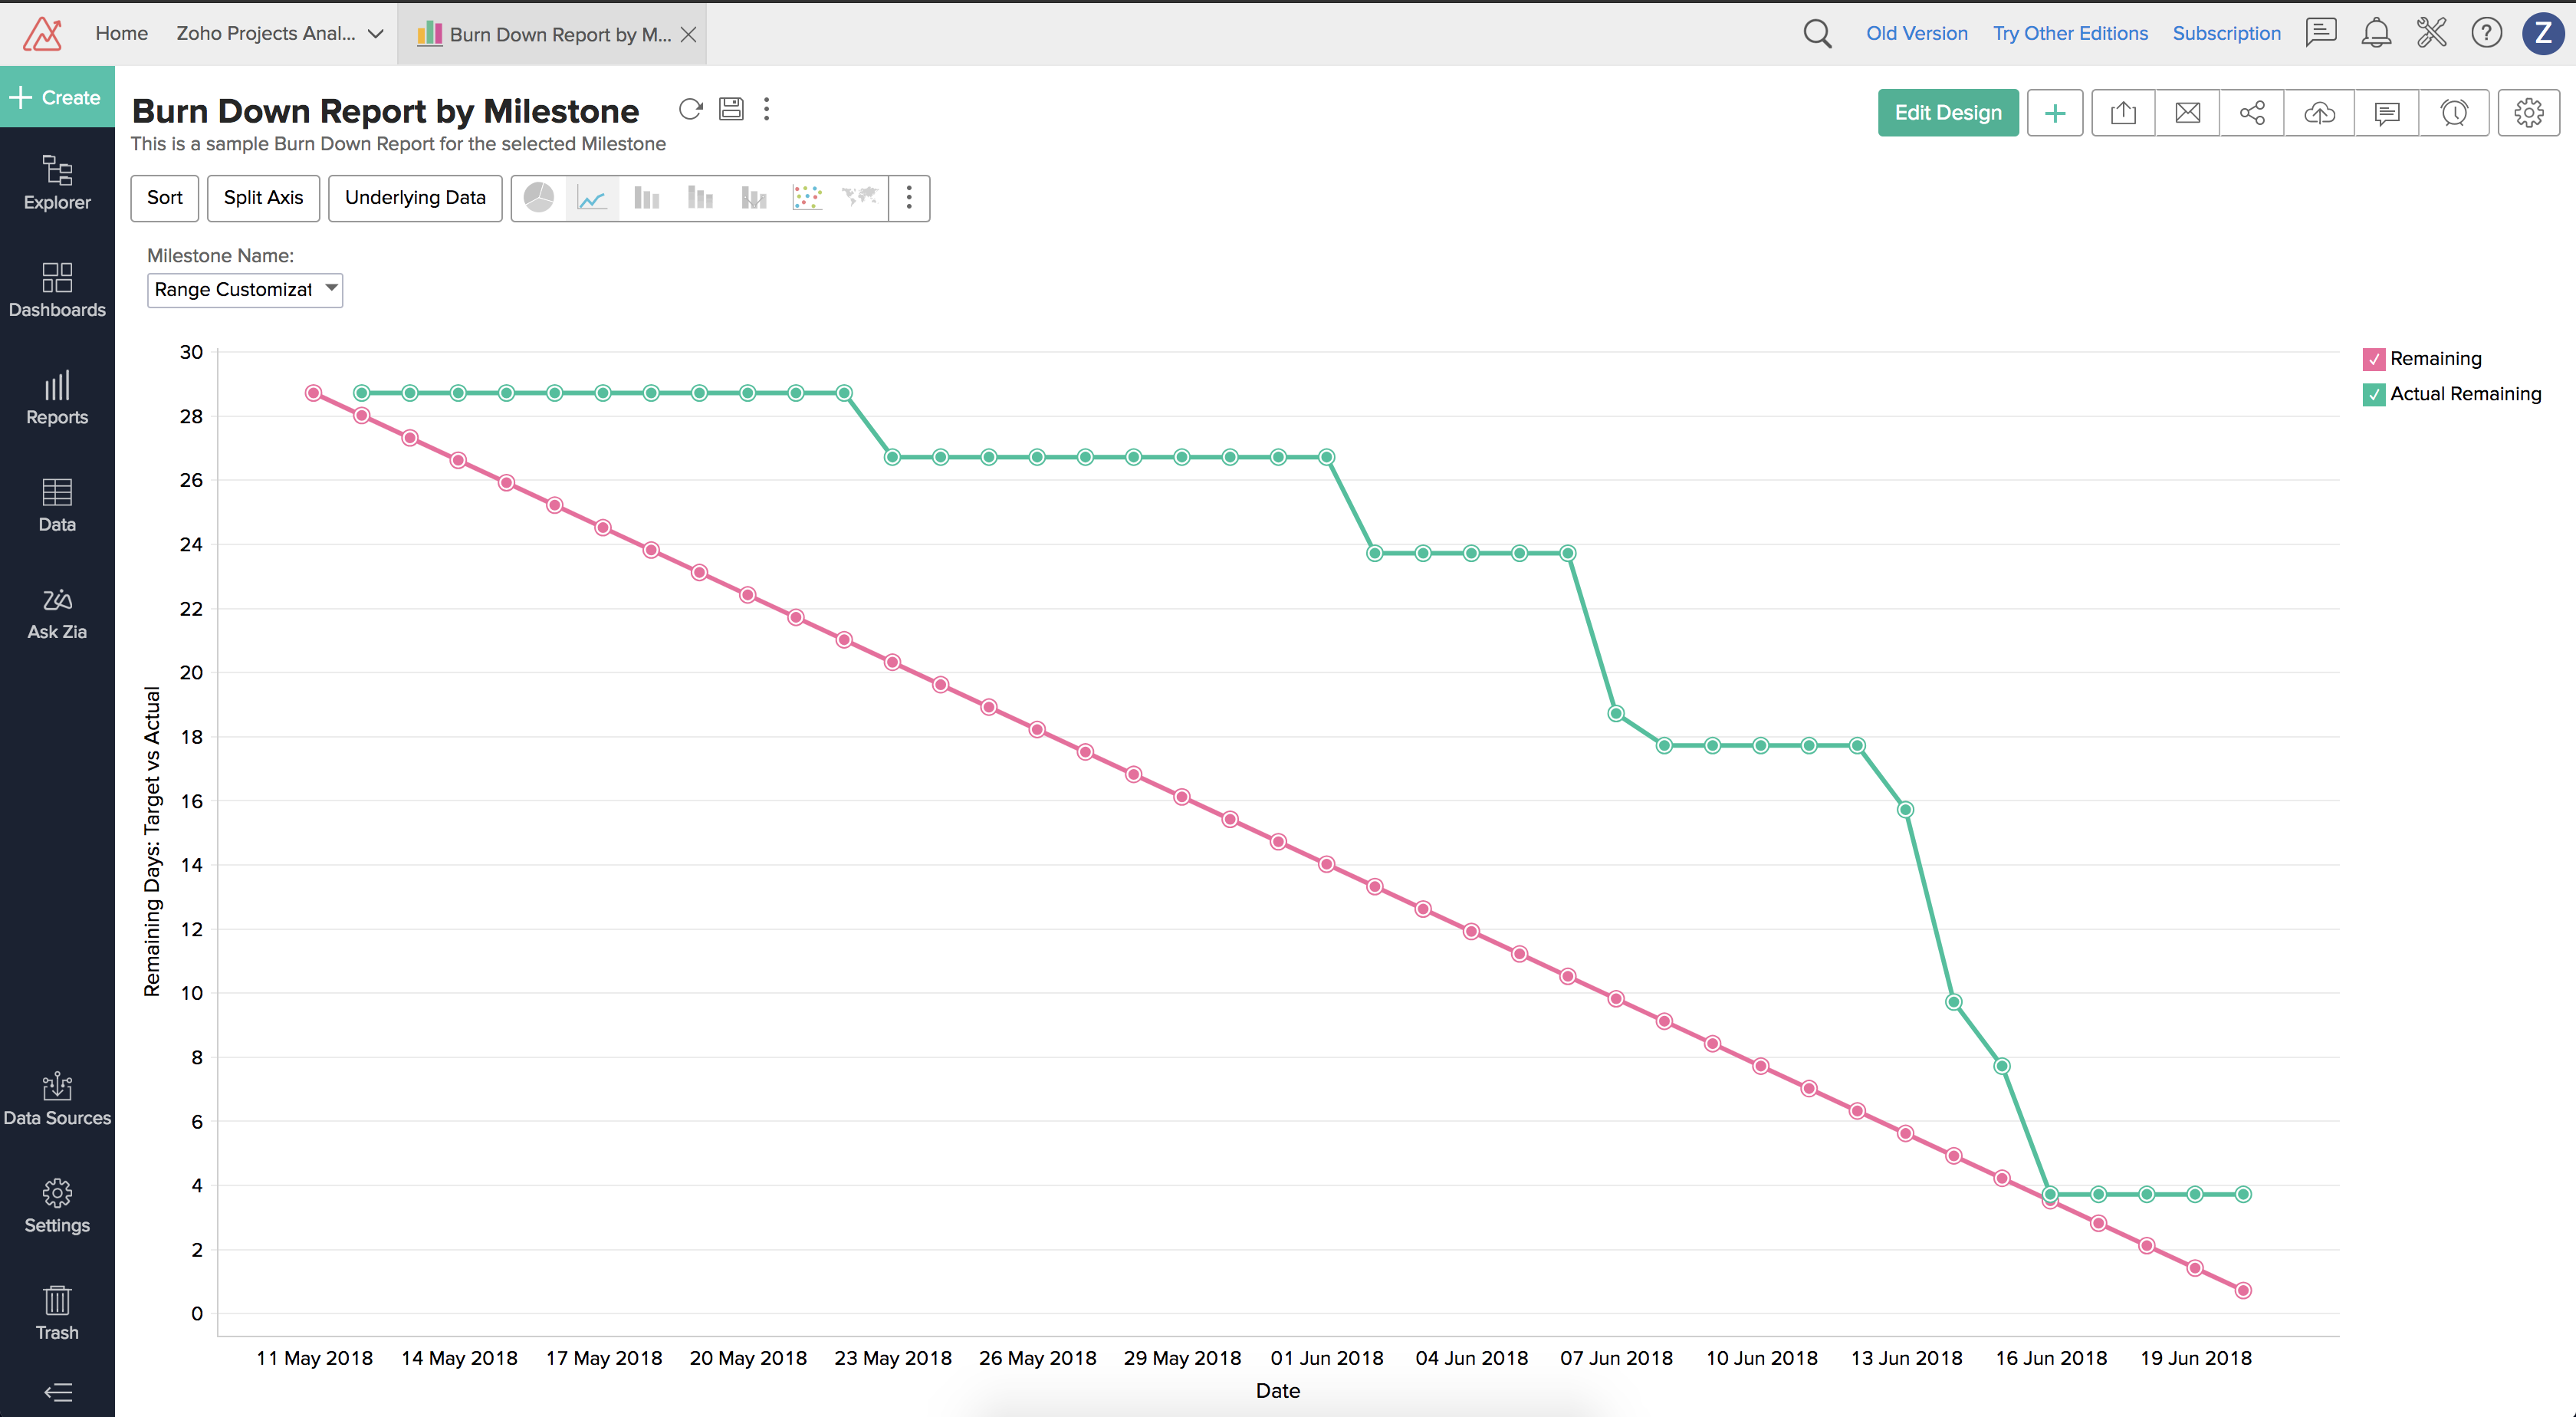
- Burn Down Report by Milestone: Burn down report for the selected milestone.
- Burn Down Report by Project: Burn down report for the selected project.
- Milestone - Burn Down Calculation Query: Internal query to calculate the burn down metrics for milestones.
- Milestone Day Wise Progress Calculation Query: Internal query for day-wise progress calculation of milestones.
- Project - Burn Down Calculation Query: Internal query to calculate the burn down metrics for projects.
- Project - Day Wise Progress Calculation Query: Internal query for day-wise progress calculation of projects.
- Timekey: Internal query for calculating the burn down reports.
Bug Reports
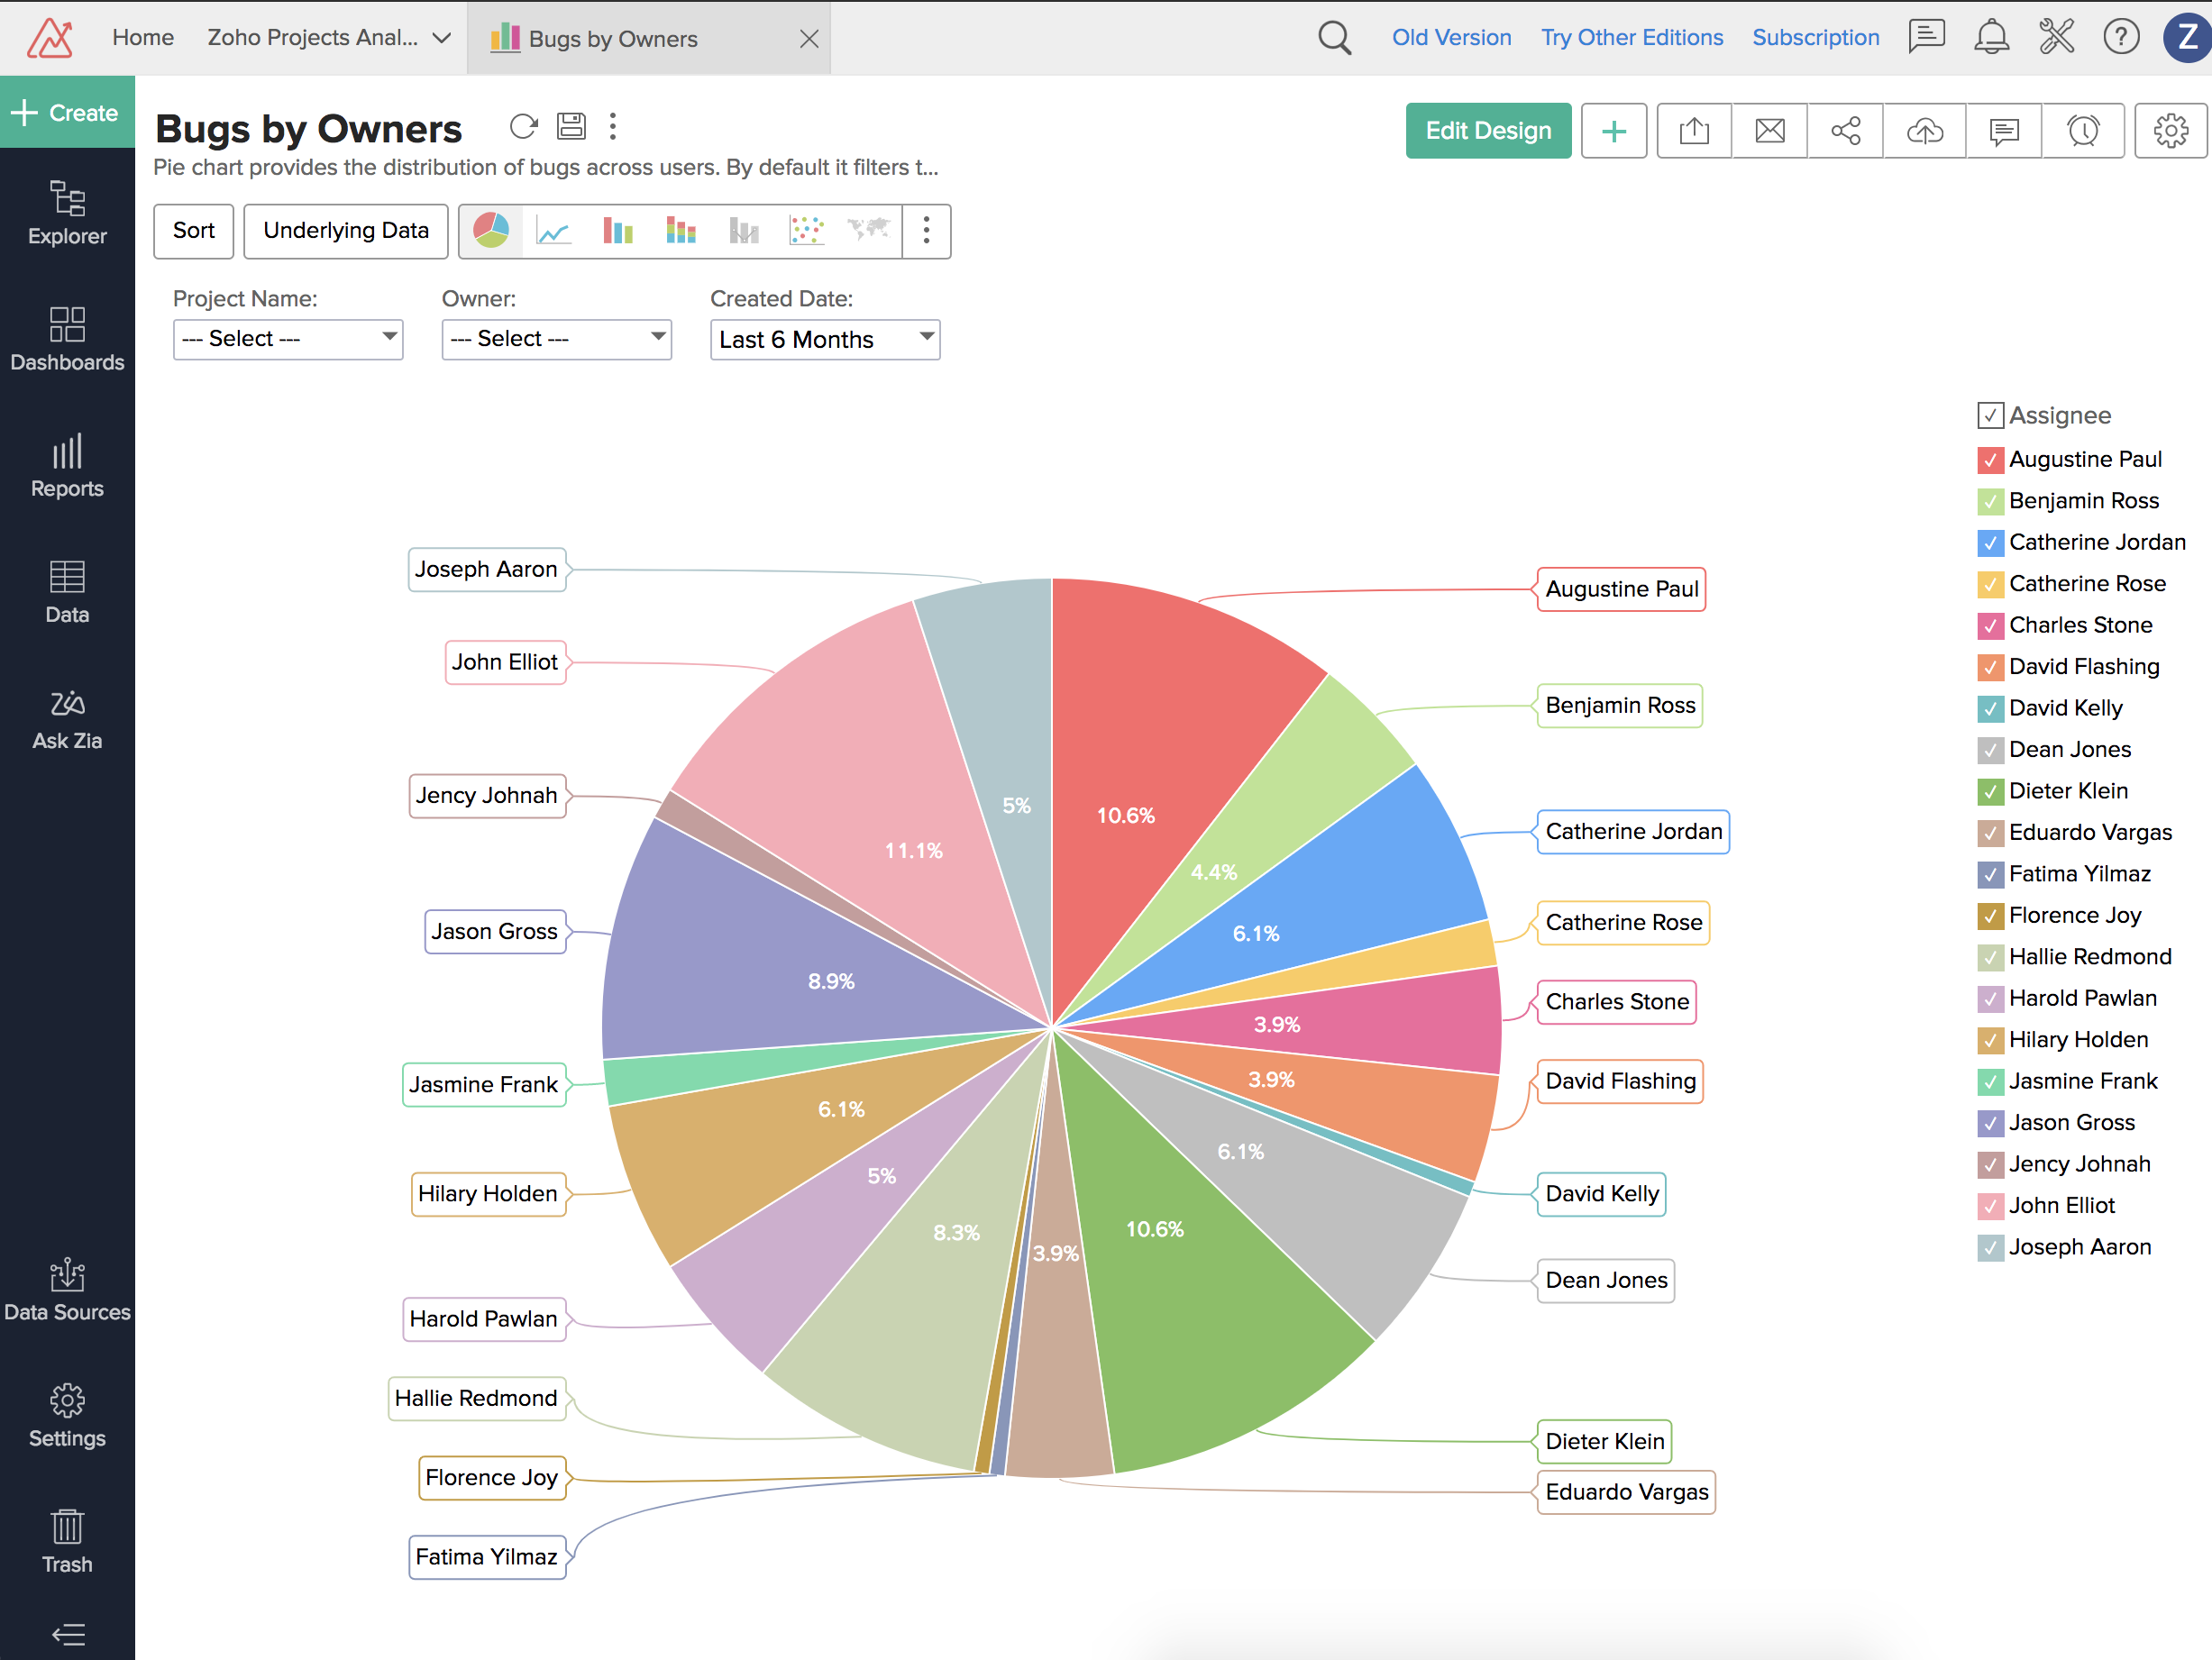
You can view bug reports based on various criteria. You can use bug reports to find bugs grouped by owners and status, view pie charts providing the distribution of bugs, categorize bugs by severity and so on. You can click on any of the views to display its data based on your requirement.
- Bugs by Owners: Pie chart based on bugs distributed across users. By default it filters the bugs raised in the last 3 months.
- Bugs by Projects: Project-wise bug counts categorized by severity.
- Bugs by Projects & Owners: Bugs grouped by Project, Owners and Status.
- Bugs by Who Raised It: Pie chart with bugs based on who raised the bugs.
- Bugs Created by Severity - Last 30 days: Bugs categorized by severity in the last 30 days.
- Bugs Fixed by Members - Last 30 days: Bugs fixed by members in the last 30 days.
- Bugs Overdue by Owners: Count of overdue bugs and their percentage (Overdue/Total), based on Owners.
- Bugs status by Projects: Summary of bugs status across all projects.
- Bugs to be Fixed by Projects - This Month : Bugs fixed / to be fixed in each project, categorized by Open and Closed status for the current month.
- Created vs Resolved Bugs - Last 30 days: Total bug count vs. the resolved bug count in the last 30 days.
- Pending Bugs across Open Milestones: Count of pending bugs across open milestones, categorized by severity.
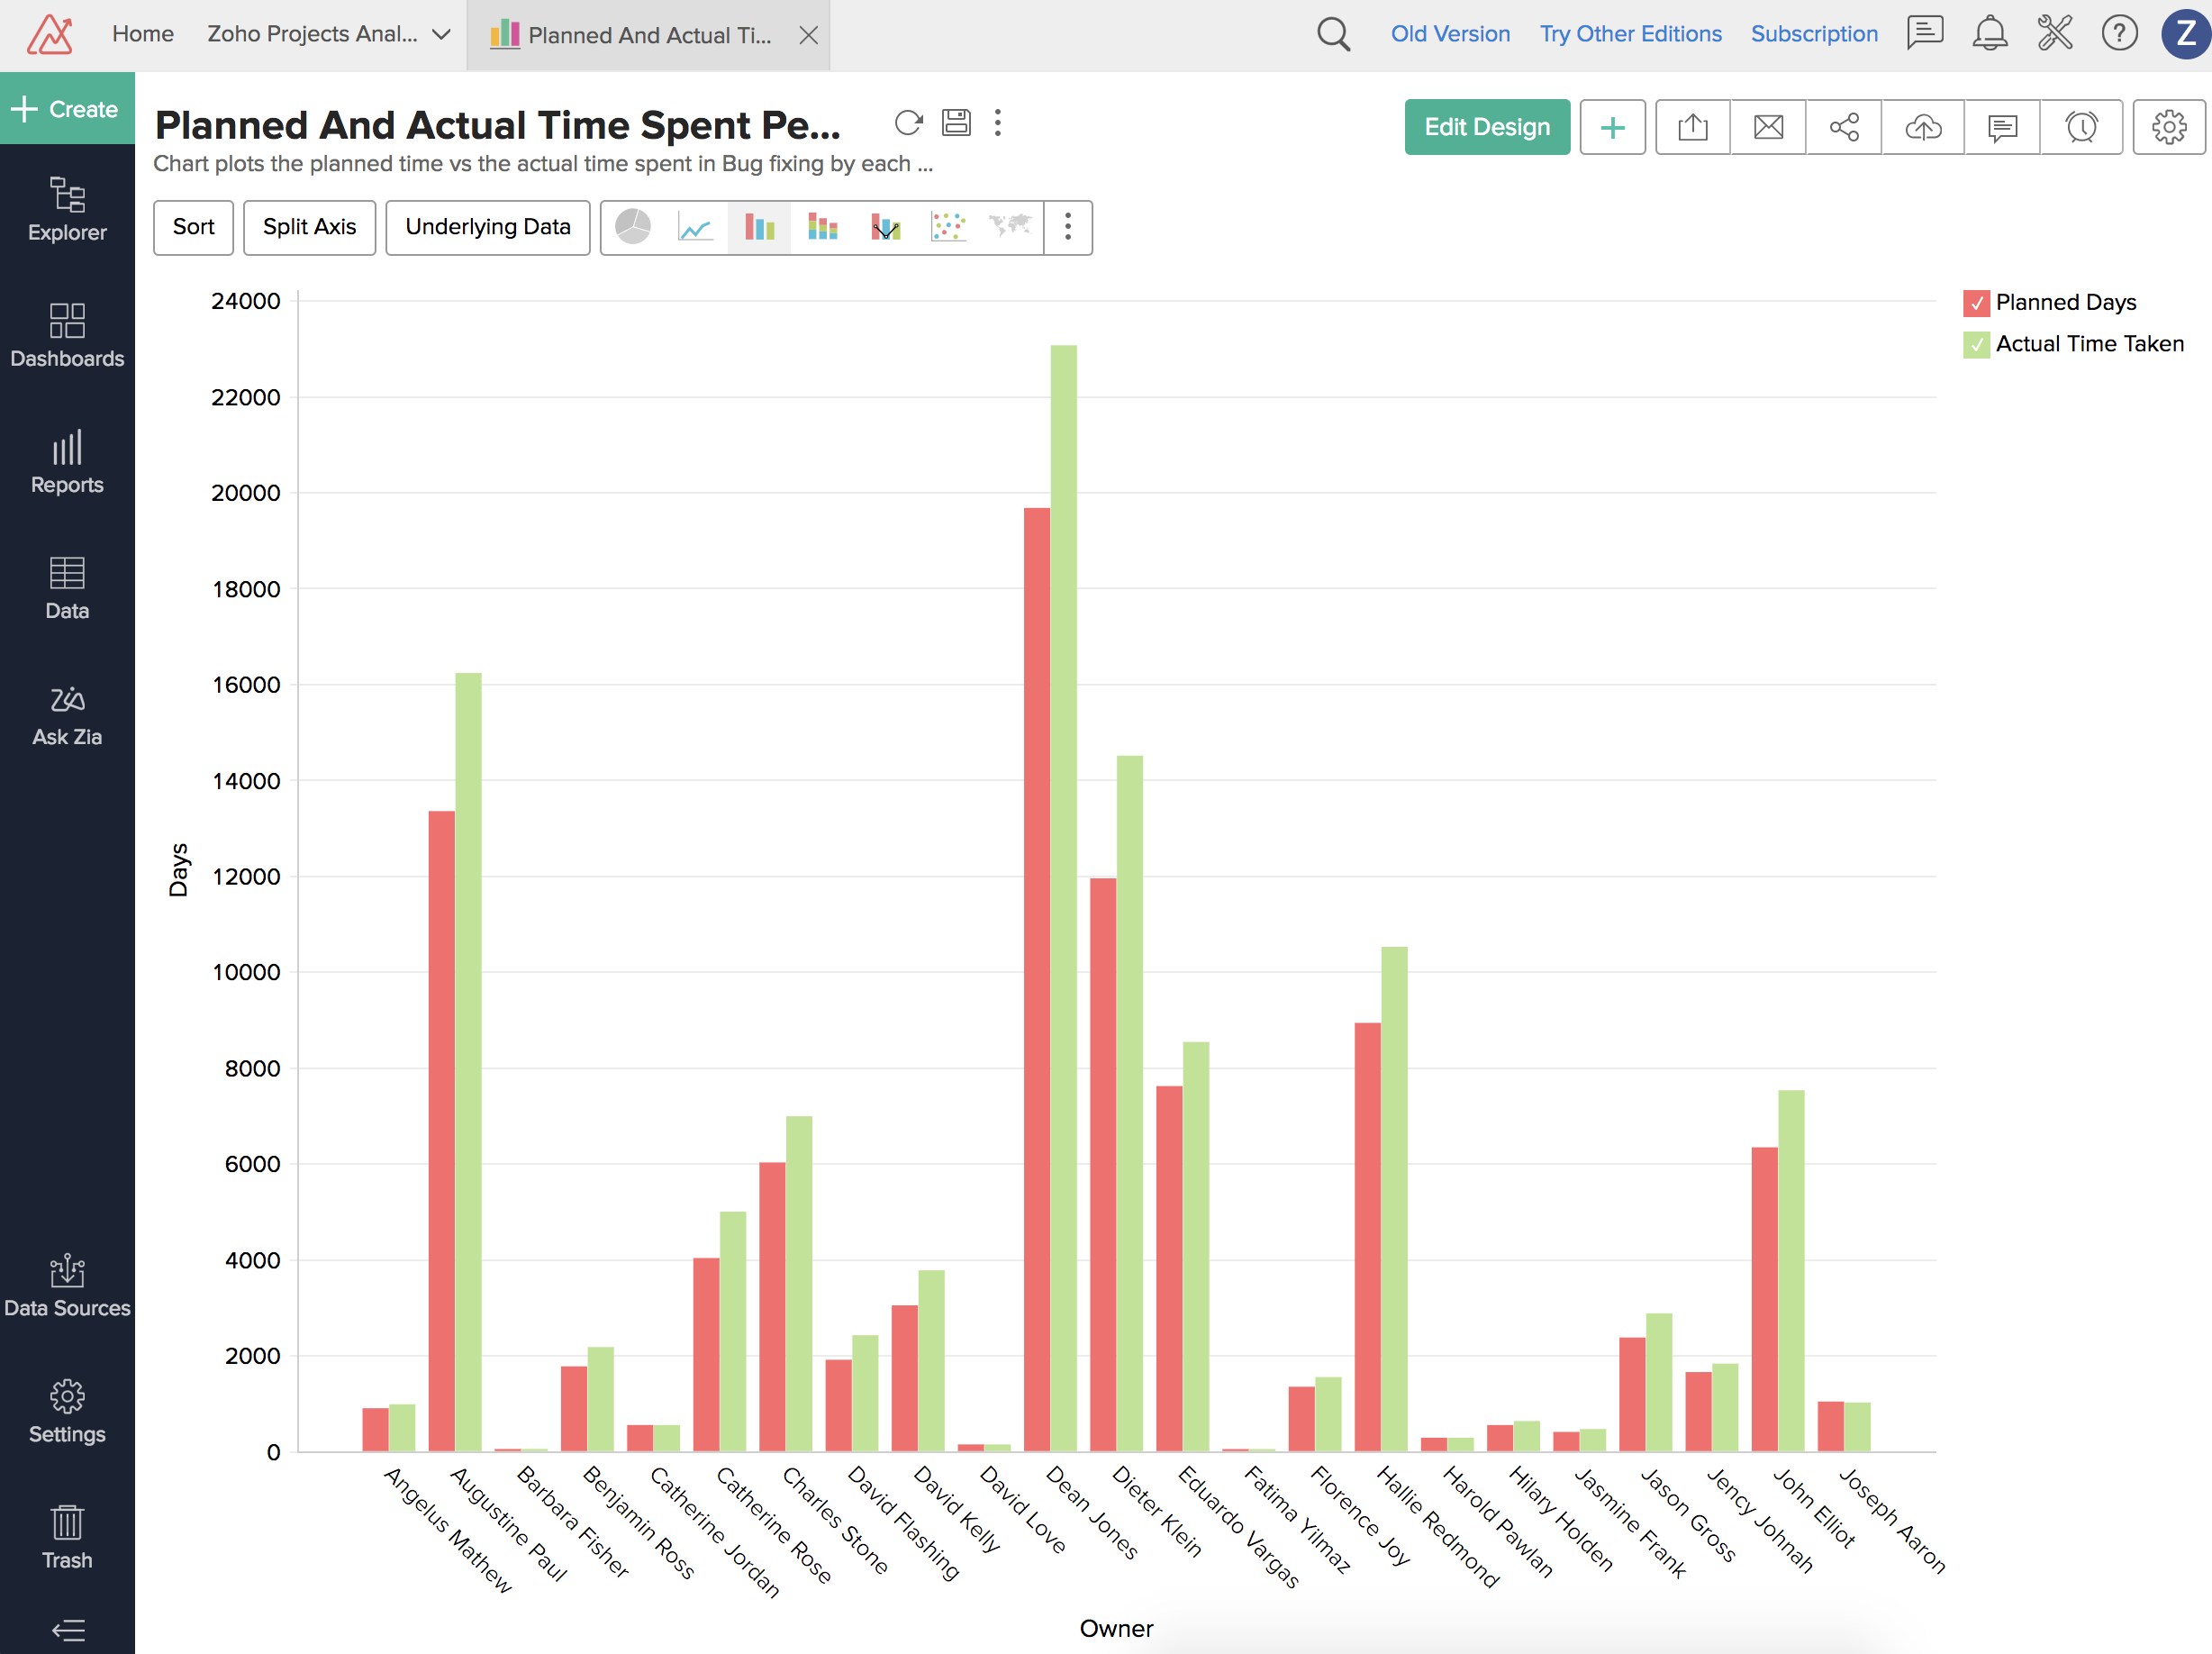
- Planned and Actual Time Spent Per Project: Planned time vs. the Actual time spent in fixing bugs for each project.
- Planned And Actual Time Spent Per User: Planned time vs. the Actual time spent in fixing bugs by each user.
- Recently Created Bugs - Last 30 days: Bugs count in the last 30 days, grouped by Open and Closed status.
- Recently Created Bugs by Severity - Last 30 days: Bugs count in the last 30 days, grouped by severity.
- Resolution Time - Last 30 days: Total resolution time of bugs closed each day, in the last 30 days.
- Top 5 Members by Bugs handled: Top 5 members, based on the total number of bugs managed.
- Top 5 Modules by Bug Count: Top 5 modules, based on the total number of bugs managed.
- Users bugs workload: Users work load, based on the count of pending bugs and their estimated time for closure.
Create New Ad hoc Reports:
Once you have integrated Projects in Reports, you can view a variety of insightful reports generated automatically based on your project data. This apart you might also want to do your own analysis and create your own reports. This can be easily done using the easy-to-use drag & drop interface of Zoho Analytics. You can also edit the default reports provided to customize it to your needs using the edit report option. This is similar in flow to that of creating new reports.
To create new ad hoc reports:
- Click Create button in the top left corner of the database and select New Report.
- Click on the required View type in the new report tab.
- Select the required table in your workspace from the Select Base Table dialog box.
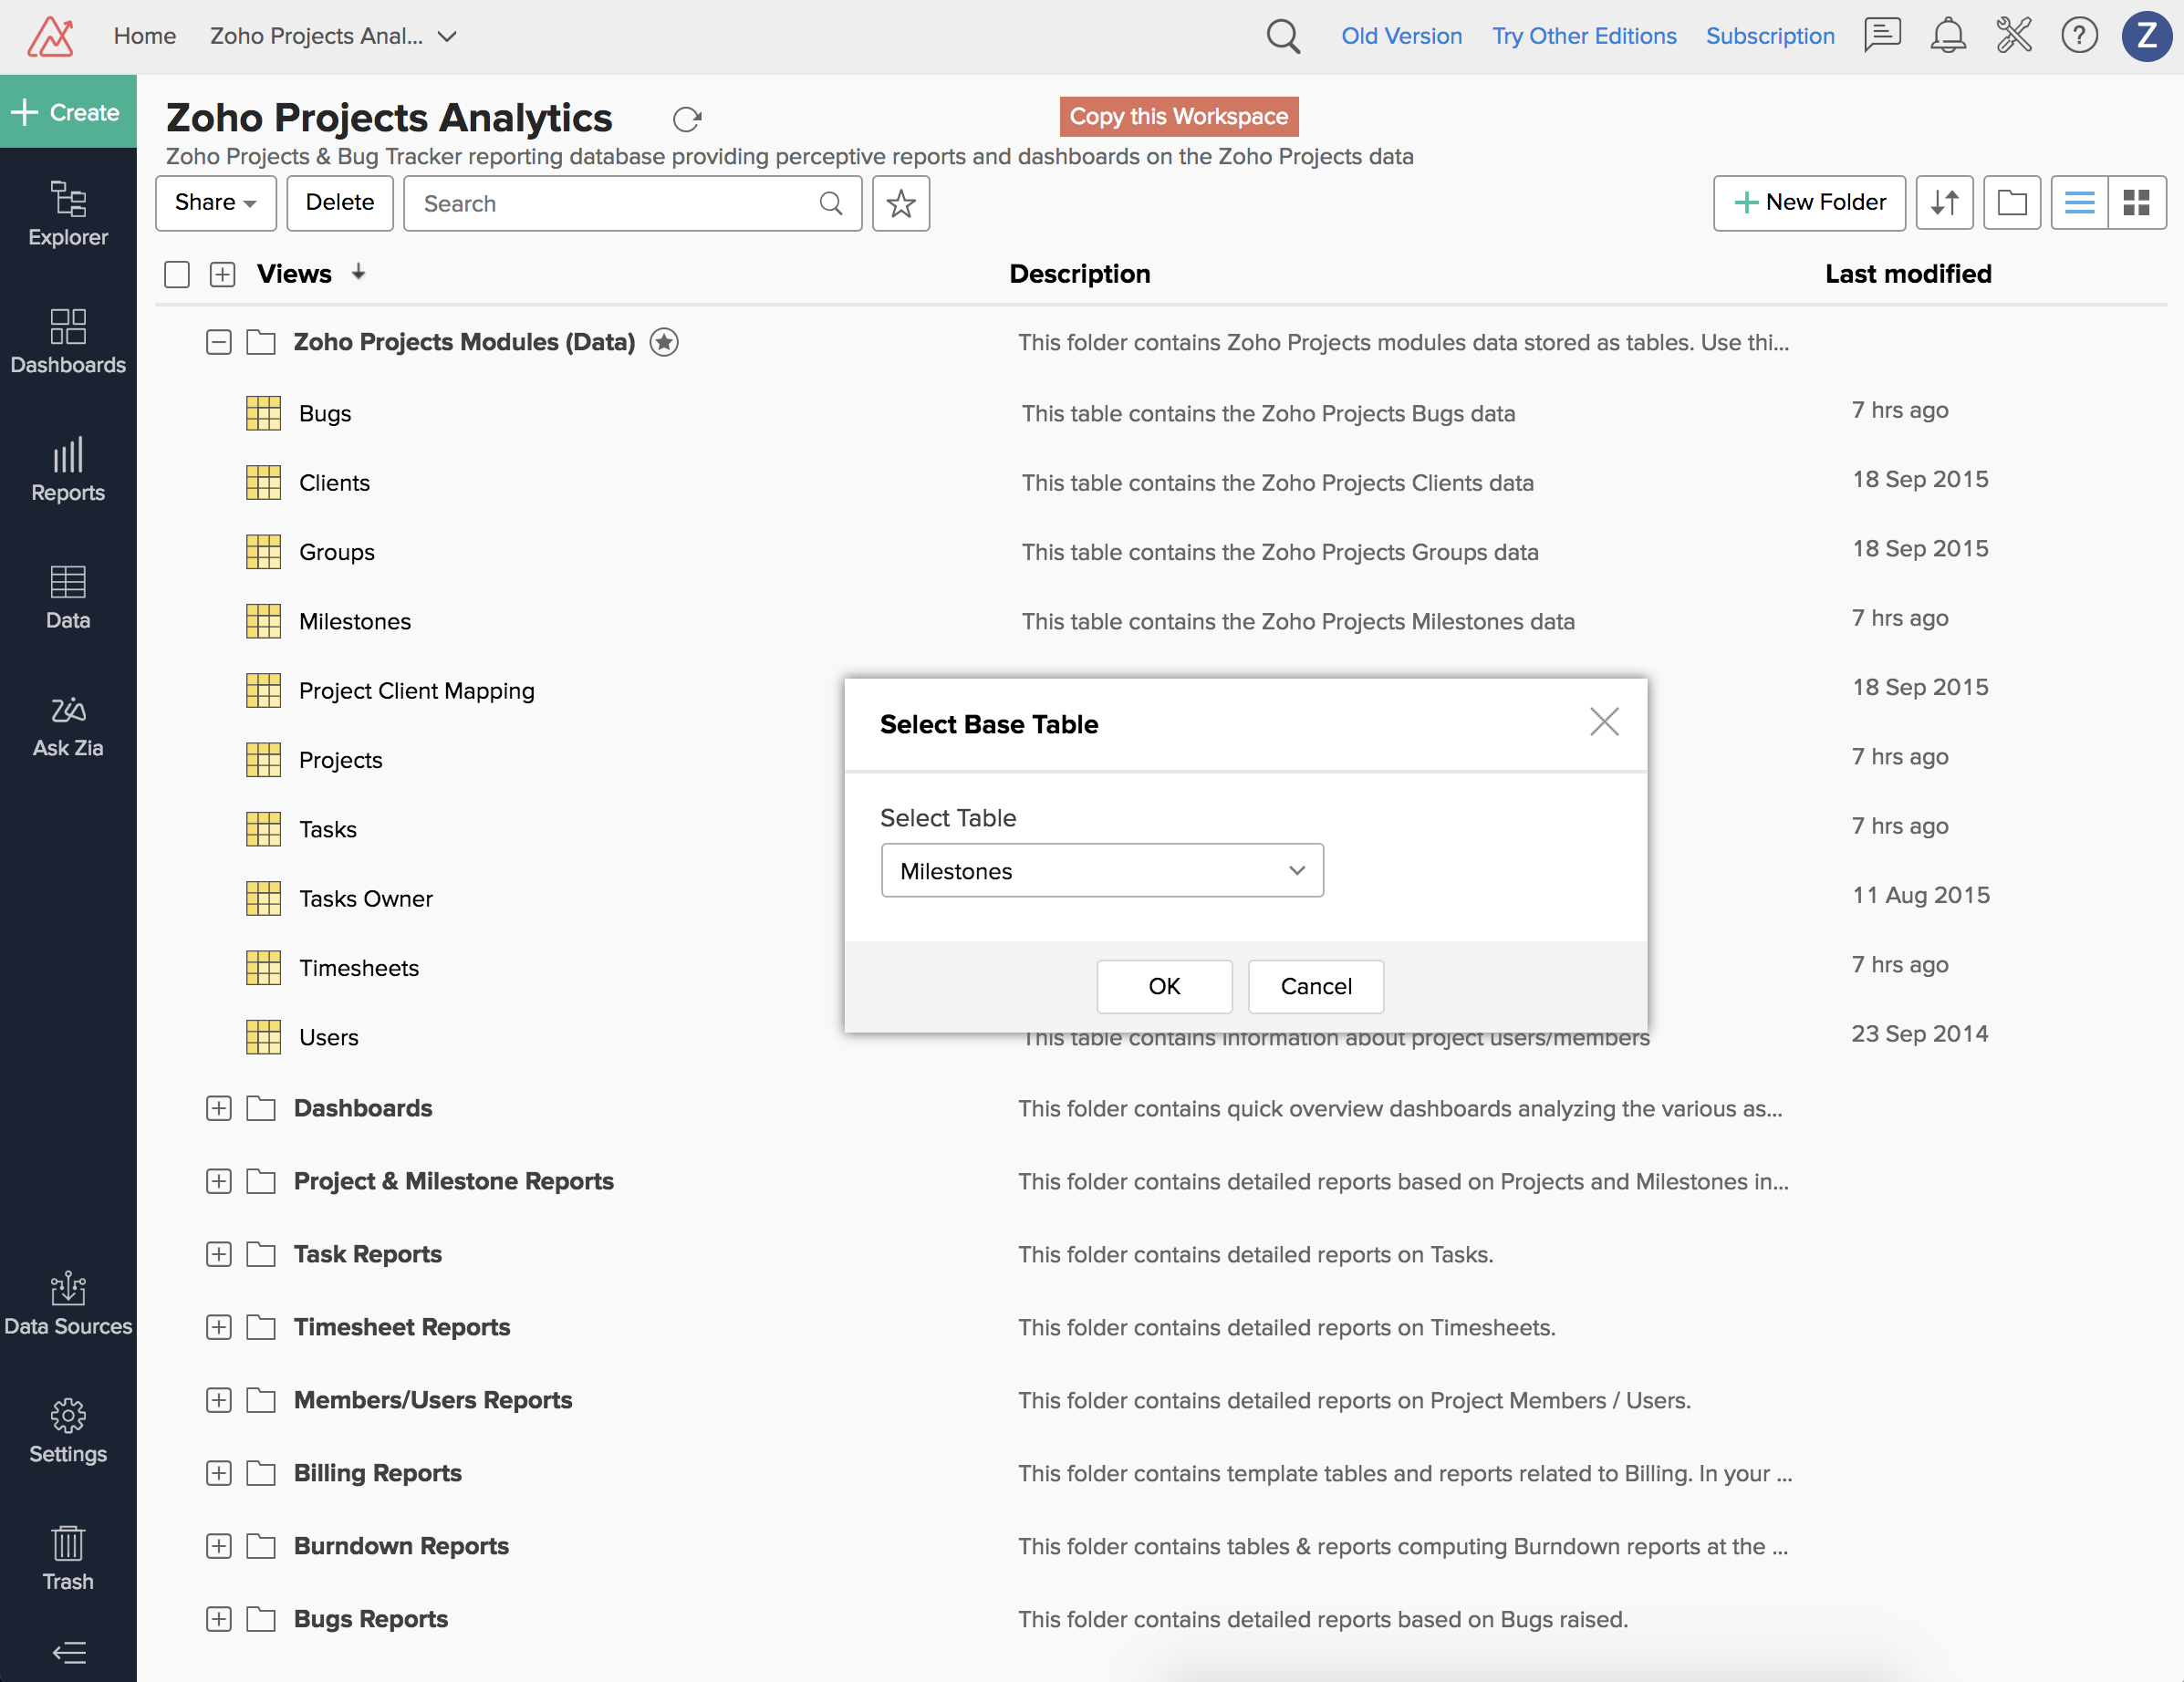
- Click OK to open up a drag and drop designer to create your chart.
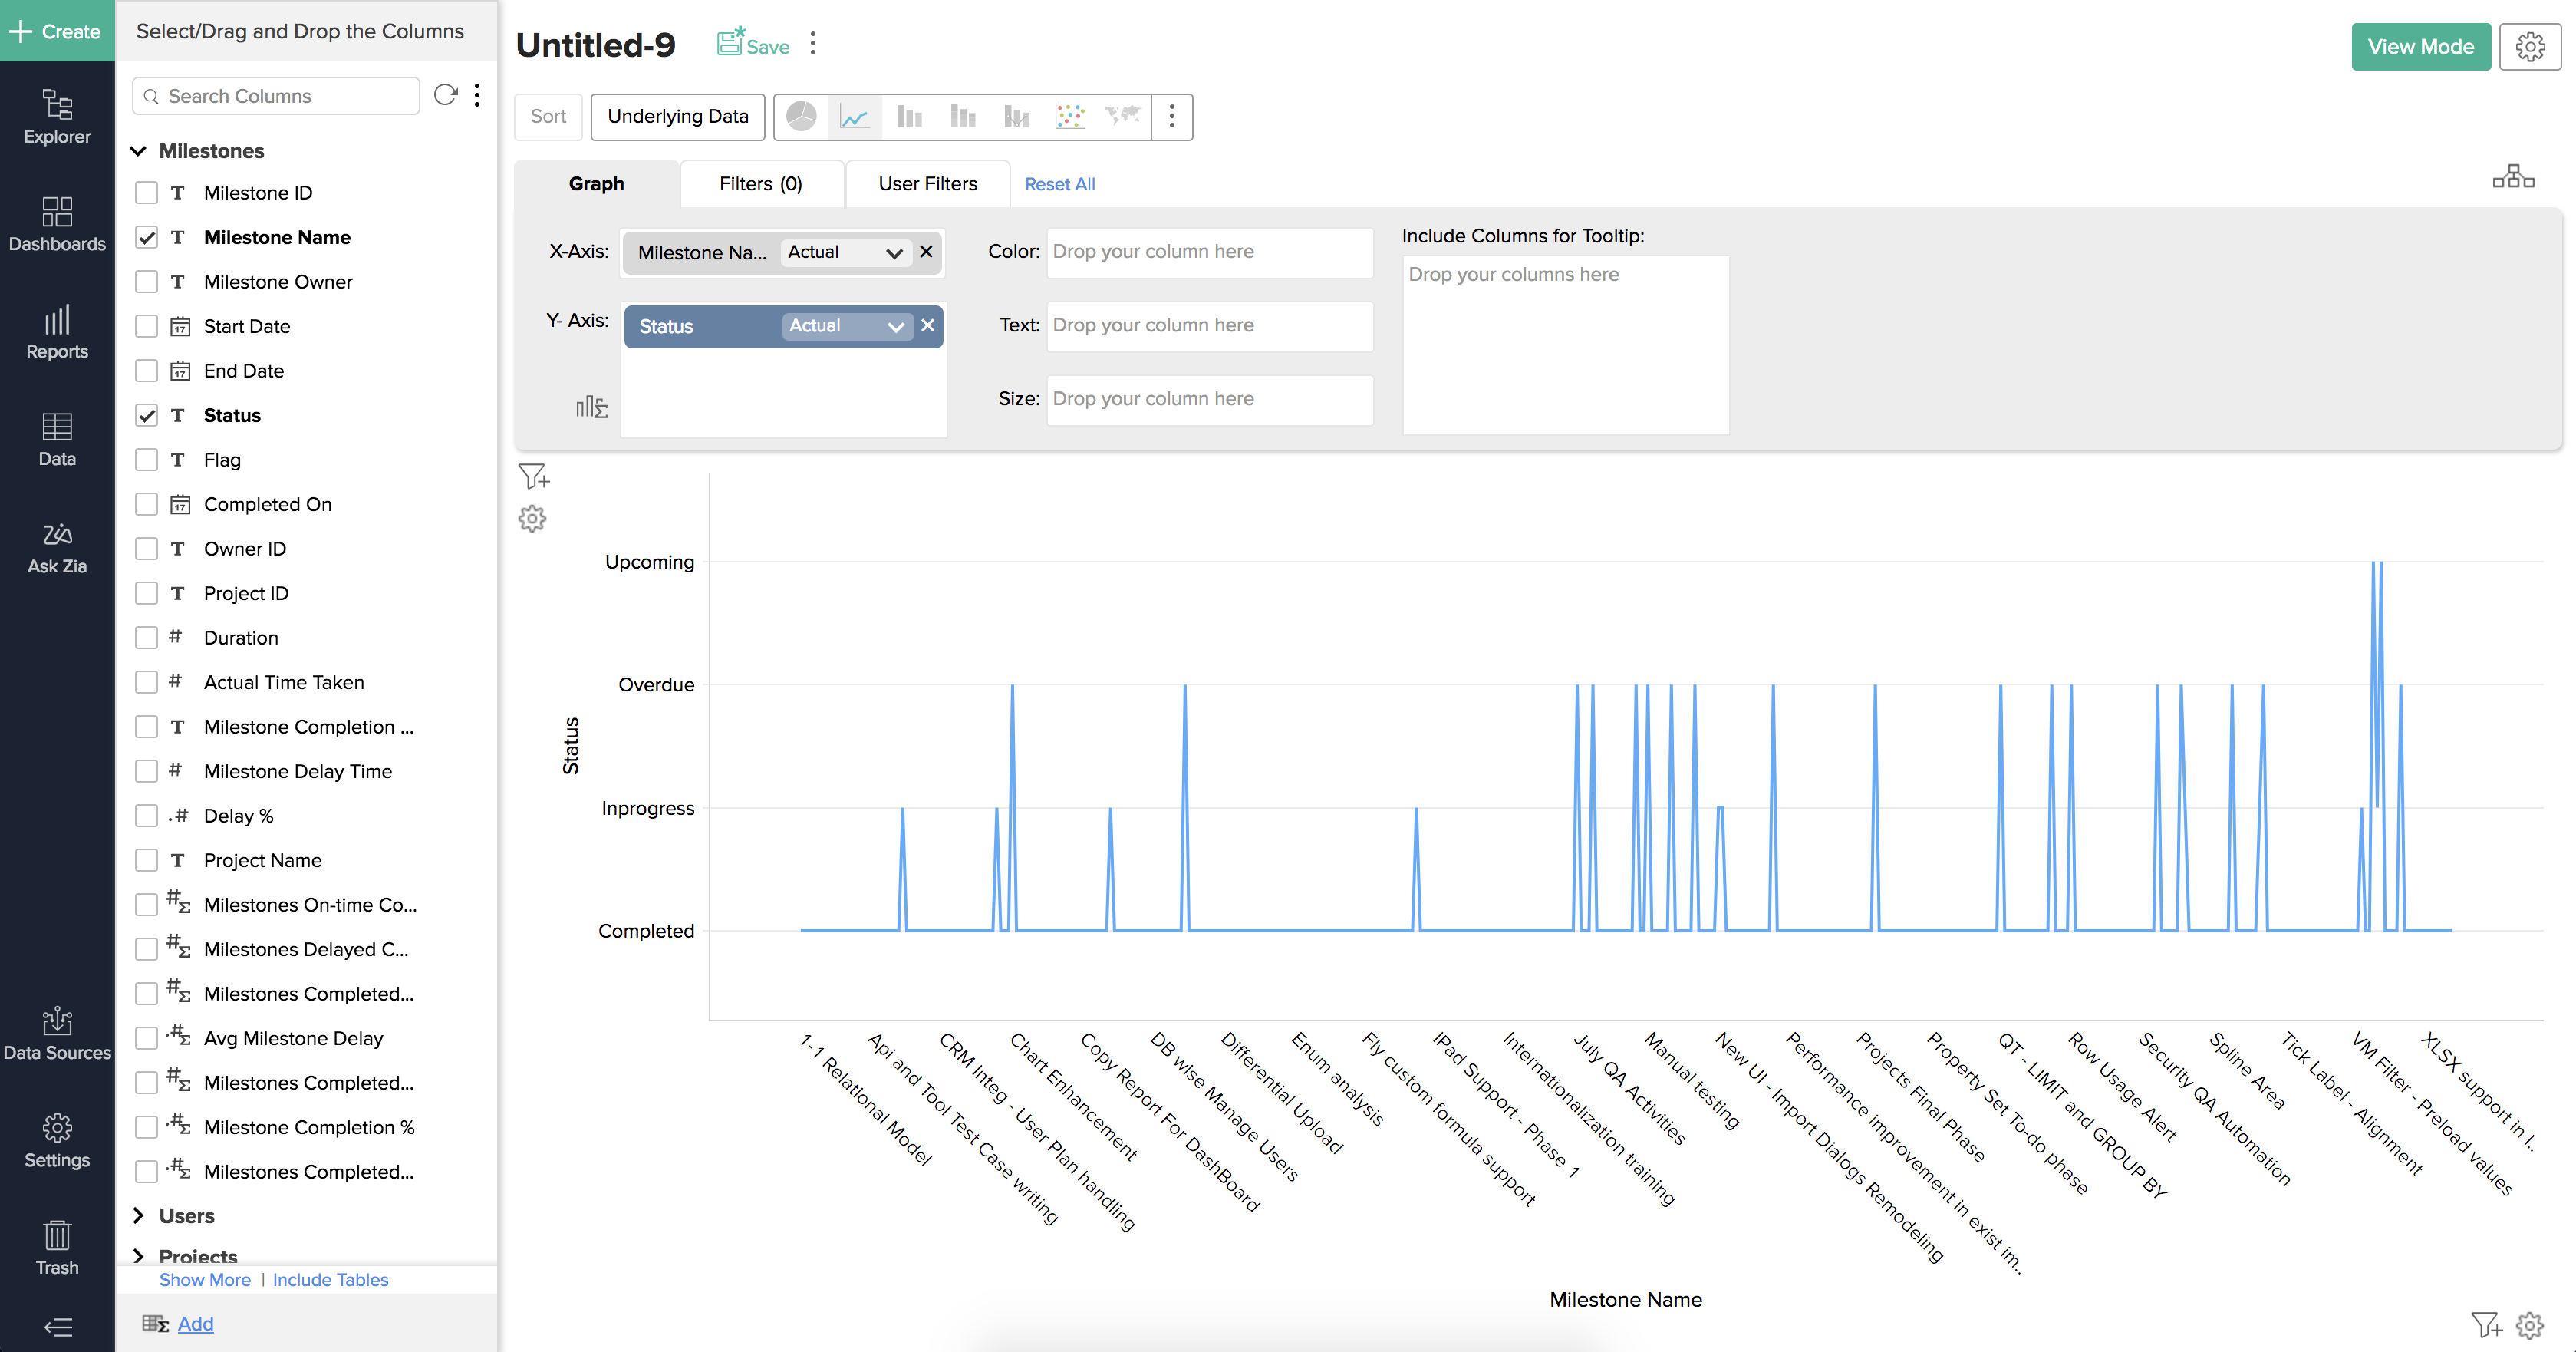
- From the Field List on the left panel, select any desired column and then drag and drop the column in X-Axis in Graph tab. Similarly select a column for the Y-Axis and then drag and drop the column in Y-Axis.
- The data dropped from these columns, is used to construct the axes of the chart/graph to be generated.
- You can also drag and drop columns in Filters and User Filters tabs to apply selected filters to the report.
- The data dropped from these columns, is used to construct the axes of the chart/graph to be generated.
- Click Click Here to Generate Graph. A report is generated based on the information provided.
- Click Save to save the report.
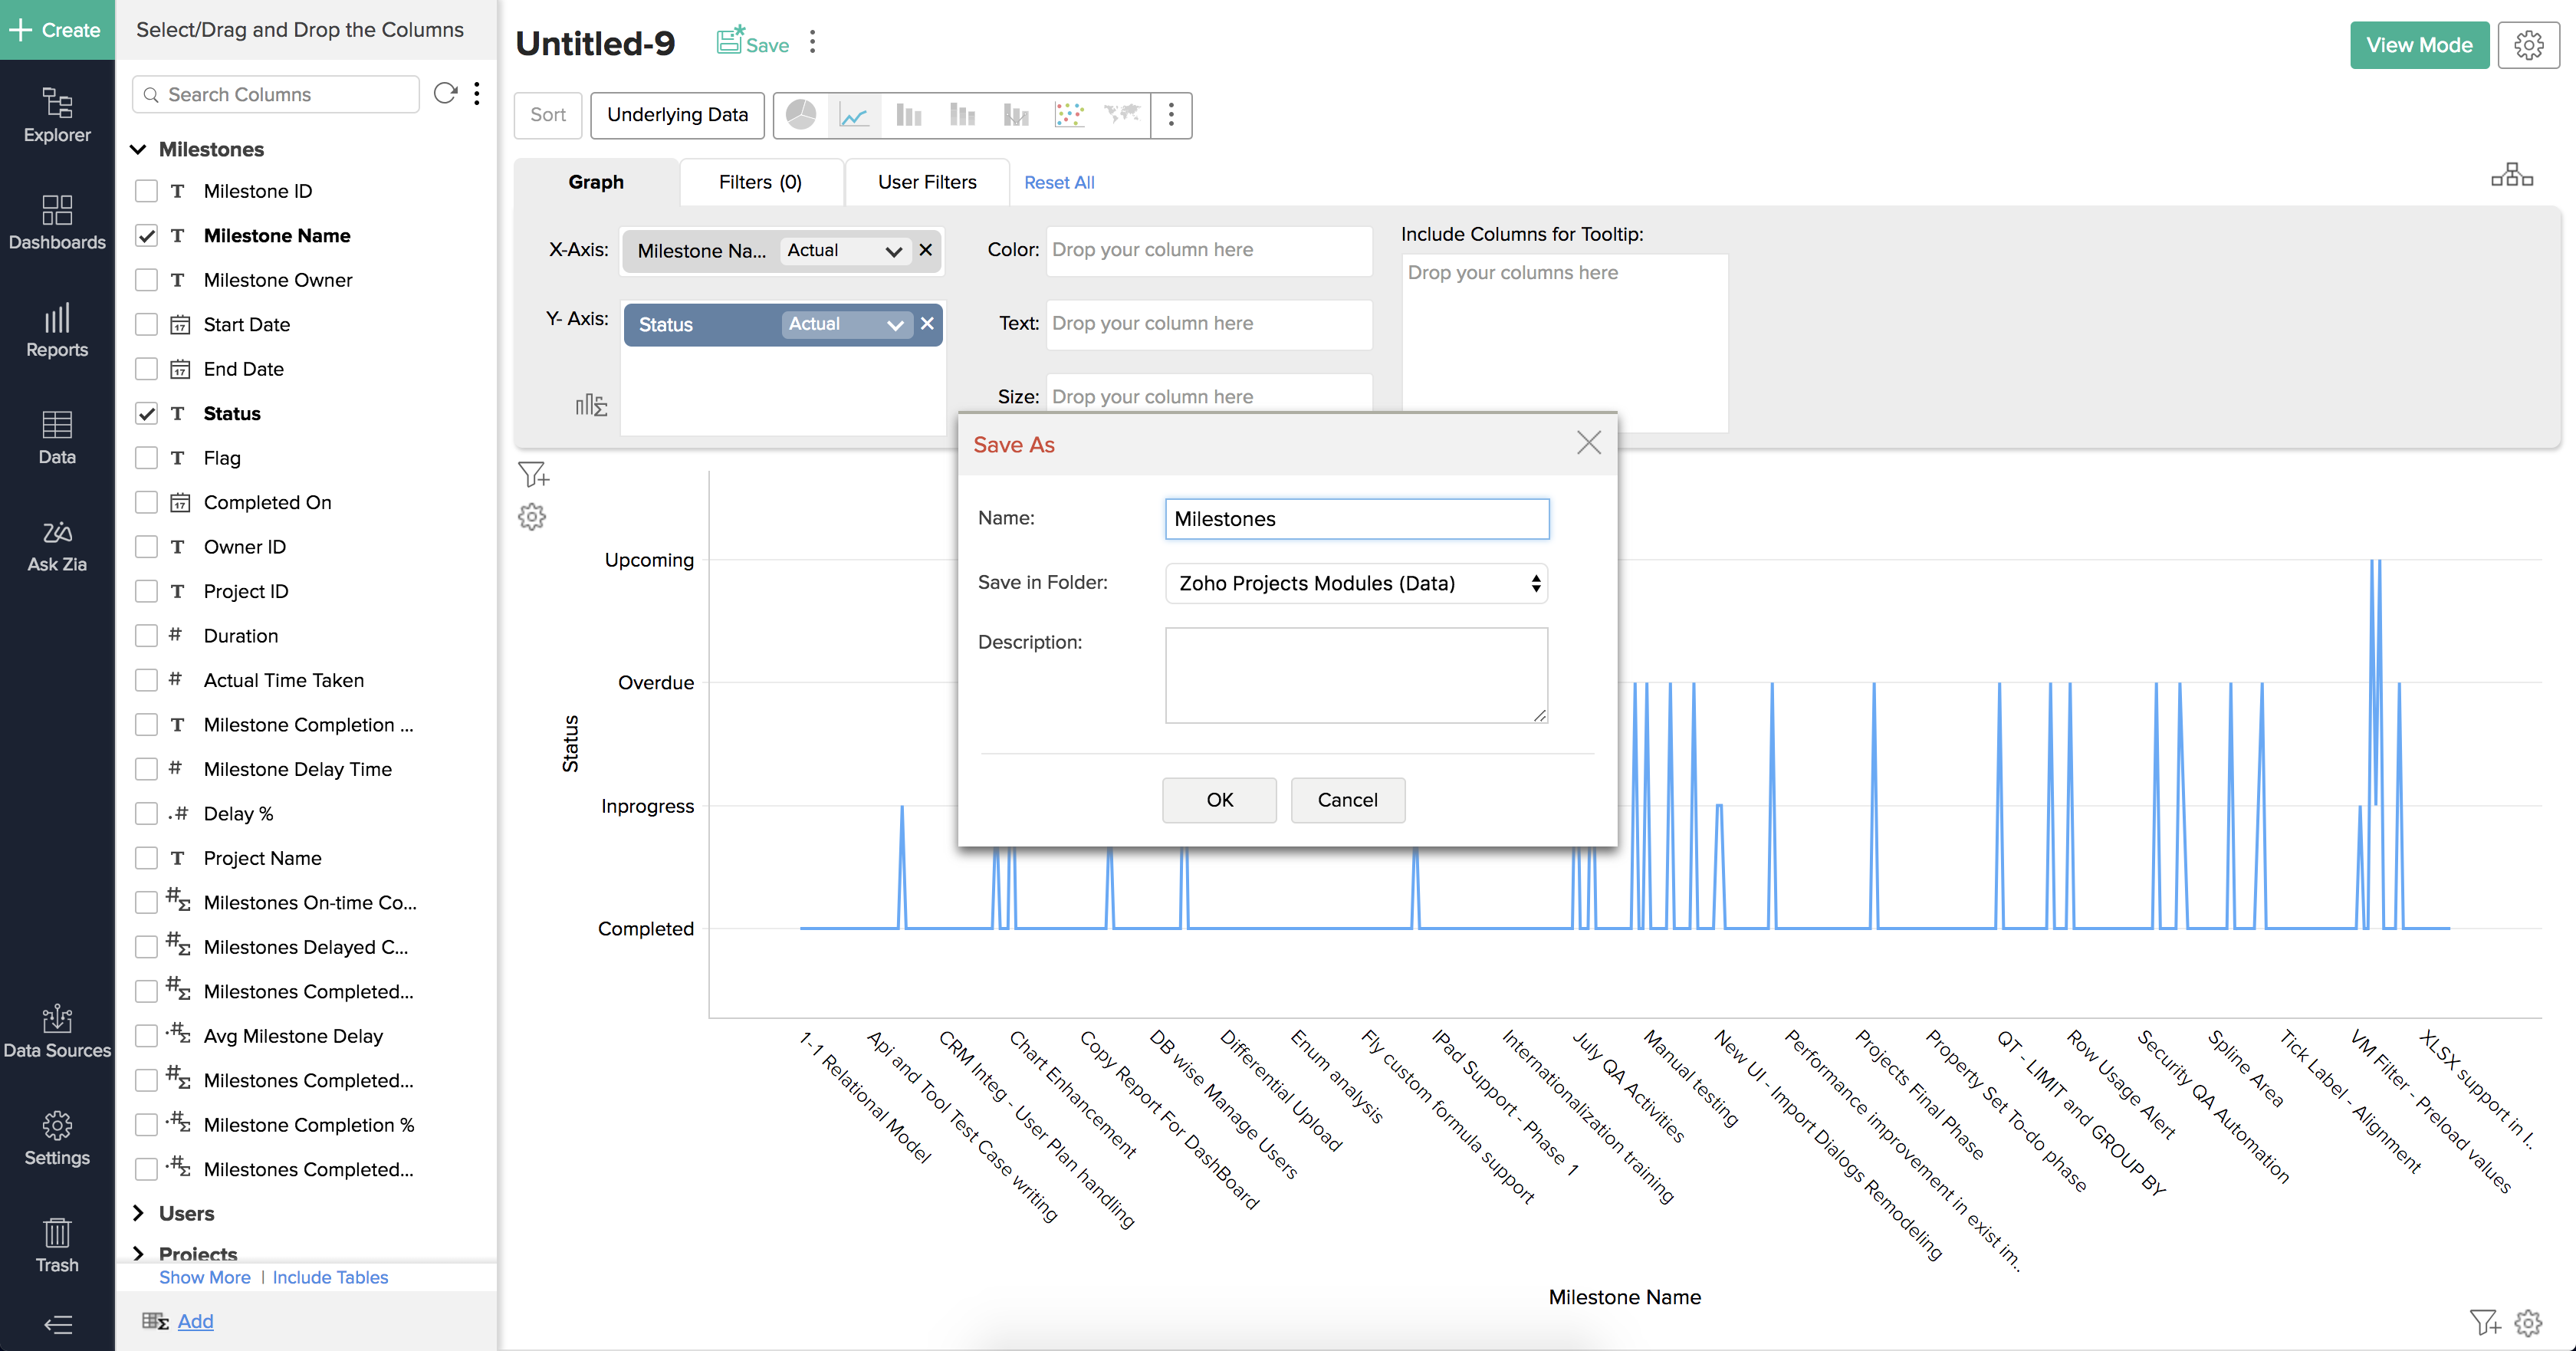
- In Name, specify a report name.
- In Save in folder, select the desired folder to save this report.
- In Description, specify additional information about the report.
- Click OK to save the report in the desired module.
Add / Delete Projects
Once you have initially synced few projects in Zoho Analytics, you can later start adding or deleting more projects as desired from Zoho Analytics or from Zoho Projects.
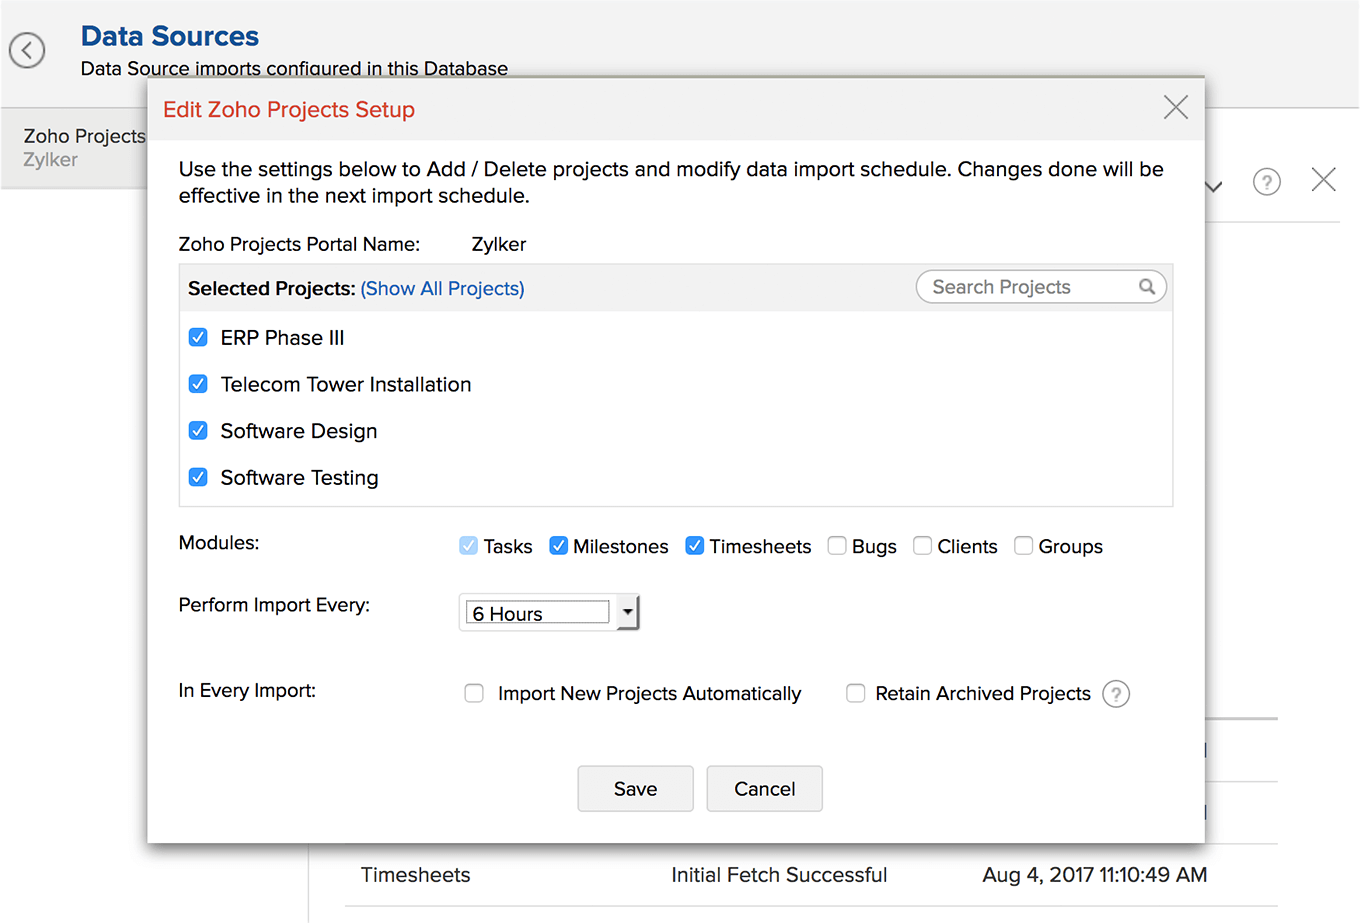
To add / delete projects from Zoho Analytics:
- In Zoho Analytics, select your workspace.
- Click Zoho Projects and then click Edit Setup.
- In Edit Zoho Projects Setup, click Show all Projects.
- Select the desired number of projects to add.
- If required, you can also clear the already selected projects to delete those data from the report.
- If required, you can also clear the already selected projects to delete those data from the report.
- If required, in Perform Import Every, you can change the frequency of time period for synchronizing the project data.
- Click Save to save the newly added projects for synchronization.
The report will reflect the modified project data in the next scheduled import.
Related Articles
What is Zoho Analytics?
Zoho Analytics is an on-demand reporting and business intelligence solution that helps you get new insights on your business information through its powerful and flexible online business intelligence engine. You get powerful reports in minutes, with ...What are the Zoho Services Zoho Analytics is integrated with?
Currently, Zoho Analytics is integrated with Zoho CRM, Zoho Recruit, Zoho Projects, Zoho BugTracker, Zoho Survey, Zoho Desk, Zoho Campaigns, Zoho Finance and Zoho Creator. We also offer integration with Manageengine ServiceDesk Plus and Manageengine ...Analytics
Overview Integrate Zoho SalesIQ with leading analytics platforms (Google Analytics, Clicky, KissMetrics Optimizely, Woopra, Piwik,MixPanel, HubSpot) and start collecting live chat related data into your analytics software. Measure your Live Chat ...Zoho Projects
Here are some common questions you might have while integrating Zoho Sprints and Zoho Projects. These are segmented based on the project, work item, log hours, and user sync to guide you better. If you questions are not answered here, you can always ...Who should use Zoho Analytics?
Follow this link for a detailed discussion on https://www.zoho.com/analytics/who-should-use-zoho-analytics.html