With the number of campaigns you send increasing day by day, there is certainly a need for you to monitor the performance of the same in a more advanced way. Zoho Campaigns brings to you advanced reports that facilitates you with insights on the top five campaigns, recently sent campaigns and a yearly statistic (Campaign-based reports). You can also view reports of the campaigns sent to a mailing list by choosing the desired lists (List-based reports).
Read on to know how advanced reports help you learn about the sent campaigns.
Campaign-based Reports
Campaign-based reports lets you view reports of your recently sent campaigns, most responded campaigns based on opens, clicks and the attached links.
- From the Navigation toolbar, choose Reports and select Campaign-based Reports.
You could check your sent campaigns' performance in three different views. Take a look at them here.
Top five campaigns
These reports show the first five campaigns and links that have the best response.
- Click the Top Five Campaigns tab.
In top five campaigns, we present the data in three categories as follows.
Click on the dropdown in the top-left corner of the section. From the dropdown, you can view three types of campaign-based reports.
Opened Campaigns
This lists the first five campaigns with respect to two entities namely open percentage and open counts. Present in the graph are information on the following elements.
Delivered - Total number of contacts that received your campaign.
Open - Total number of times your campaign was opened.
Open percentage - Open rate of the campaign in percentage scale.
Entities:
- Opens by Location
This data allows you to see the top five locations the campaigns were opened from and open count from each country. You can use the data later for segmentation.
Clicked Campaigns
This lists the first five campaigns with respect to two entities namely click percentage and click counts. Present in the graph are information on the following elements.
Open - Total number of times your campaign was opened.
Click - Total number of times links attached in the campaign were opened.
Click percentage - Open rate of the links in percentage scale.
Entities:
Click Percentage - The graph displays the top five opened campaigns based on click percentage of the URLs attached.

Click Count - The graph displays those five campaigns that have highest number of URL clicks.

Clicks by Location
This data shows you the top five locations campaign links got opened from and the open count from each country. You can use the data later for segmentation.
Clicked URLs
This shows those five links that received the highest number of visits. It gives data on the following elements.
Click - Total number of times the respective link was opened.
Link occurrence count - Total number of times the respective link has occurred in the sent campaigns.

Last five campaigns
These reports show the last five campaigns' response with respect to opens and clicks.
- Click the Last Five Campaigns tab.
You can view the following data here:
Delivered - Total number of contacts that received your campaign.
Open - Total number of times your campaign was opened.
Click - Total number of times links attached in the campaign were opened.
Open percentage - Open rate of the campaign in percentage scale.
Click percentage - Open rate of the links in percentage scale.
Opens by Location
This data allows you to see the locations these five campaigns were opened from and open count from each country. You can use the data later for segmentation.
Last 30 days
This section provided you with reports of the campaigns sent in the last 30 days.
- Click the Last 30 Days tab.
In last 30 days, we present the data in two categories as follows:
Opens
The graph here shows data on the open count of campaigns sent in the last 30 days. Use the scroll bar, on the bottom of the graph, to move to a different campaign and view its data.
Clicks
The graph here shows data on the open count of links attached in campaigns sent in the last 30 days. Use the scroll bar, on the bottom of the graph, to move to a different campaign and view its data.
Yearly Report
In yearly stats, we show the performance of campaigns sent throughout a year.
- Click the Yearly Report tab.
Data for a particular year is represented in two ways. You can select them from the dropdown in the top-left highlighted section.
Campaign Aggregate
This report shows data on the campaign response based on months for the whole year you have selected. To view reports for a particular year,
Select year from the dropdown option present in the right corner of the graph.

Monthly Aggregate
This report shows campaign-wise data for every month of the selected year. To view reports of a particular year,
- Select year from the dropdown option present in the right corner of the graph.
- If you want to view data for specific months, you have the option to deselect the remaining months as shown in the image.

Comparison
You can compare your campaigns' performance in two ways:
Yearly
You can see how your campaigns have performed over the years through Yearly Comparison. Click the Add icon to choose for which years you want to make the comparison. Click the Compare button to see the results.
Quarterly
You can view your campaigns' performance over years by dividing the years into four quarters. Select the start and end year for the comparison. Select the month from which you want a quarter to begin. You can only compare the quarterly reports of five consecutive years.
List-based Reports
This is an advanced report that shows how your contacts have responded to campaigns that you sent, top five campaigns and an yearly data on campaigns, all of this subject to a particular to a mailing list.
- From the Navigation toolbar, choose Reports and select List-based Reports.
- Select the desired mailing list from the dropdown option present in the top-right corner.
Take a look at the different elements that list-based reports present to you.
This gives you data on contacts from the selected mailing list, based on their response to campaigns sent to that list so far. This information will help you encourage the active contacts and focus more on the contacts that are less active, with your nurturing campaigns.
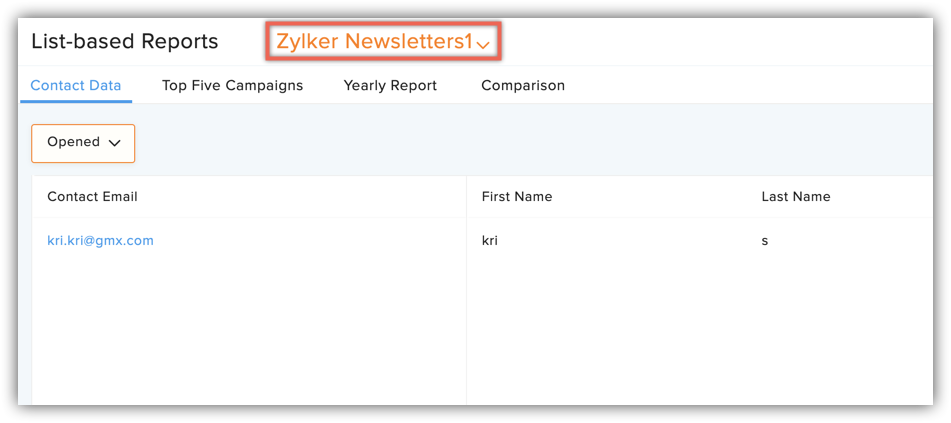
- Click the Contact Data tab in List-based Reports.
- You can select your different mailing lists from the dropdown.
You can view the reports based on different data from the dropdown.
Opened
This lists down the contacts who have opened one more campaigns sent to the mailing list.
Never opened
This lists down the contacts who haven't opened any of the campaigns sent to the mailing list.
Not opened recently
This lists down the contacts who have not opened campaigns sent to the mailing list, in recent times which can range from the last one month to the last 12 months.
Never received a campaign
This lists down the contacts in the mailing list who have not received even one campaign.
Devices and operating systems
This shows the various devices used by your contacts as a percentage. When you can see what systems your customers are using, you can optimize your messages for them.
Email clients and Web browsers
This lets you see the email clients your contacts are using to view your emails, and the web browsers they are using to read your emails and open your links.
Top five campaigns
These reports show the first five campaigns and links that have the best response. This is similar to the one shown in Campaign-based Reports but with regard to a particular mailing list.
In top five campaigns, we present the data in three categories as follows.
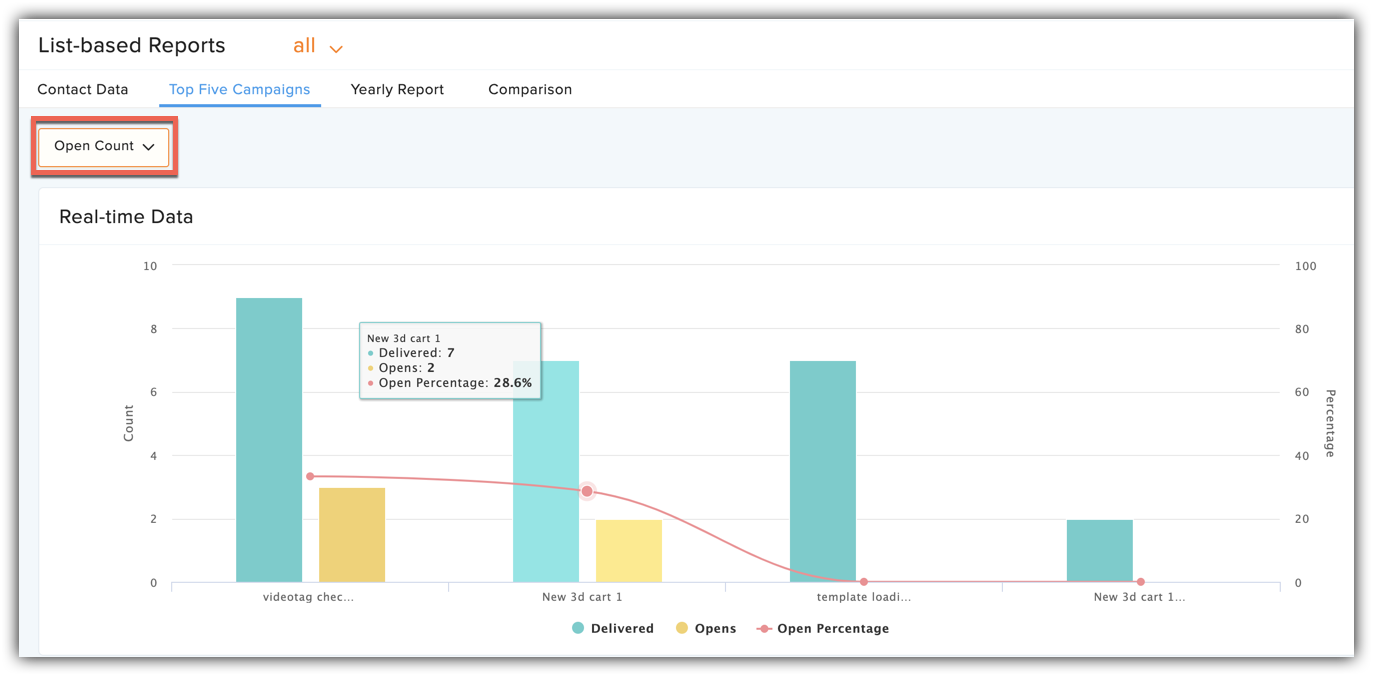
Opened Campaigns
This lists the first five campaigns with respect to two entities namely open percentage and open counts, for the selected mailing lists. Present in the graph are information on the following elements.
Delivered - Total number of contacts in that received your campaign.
Opens - Total number of times your campaign was opened.
Open percentage - Open rate of the campaign in percentage scale.
Entities:
- Open Percentage - The graph displays the top five opened campaigns based on their open percentage.
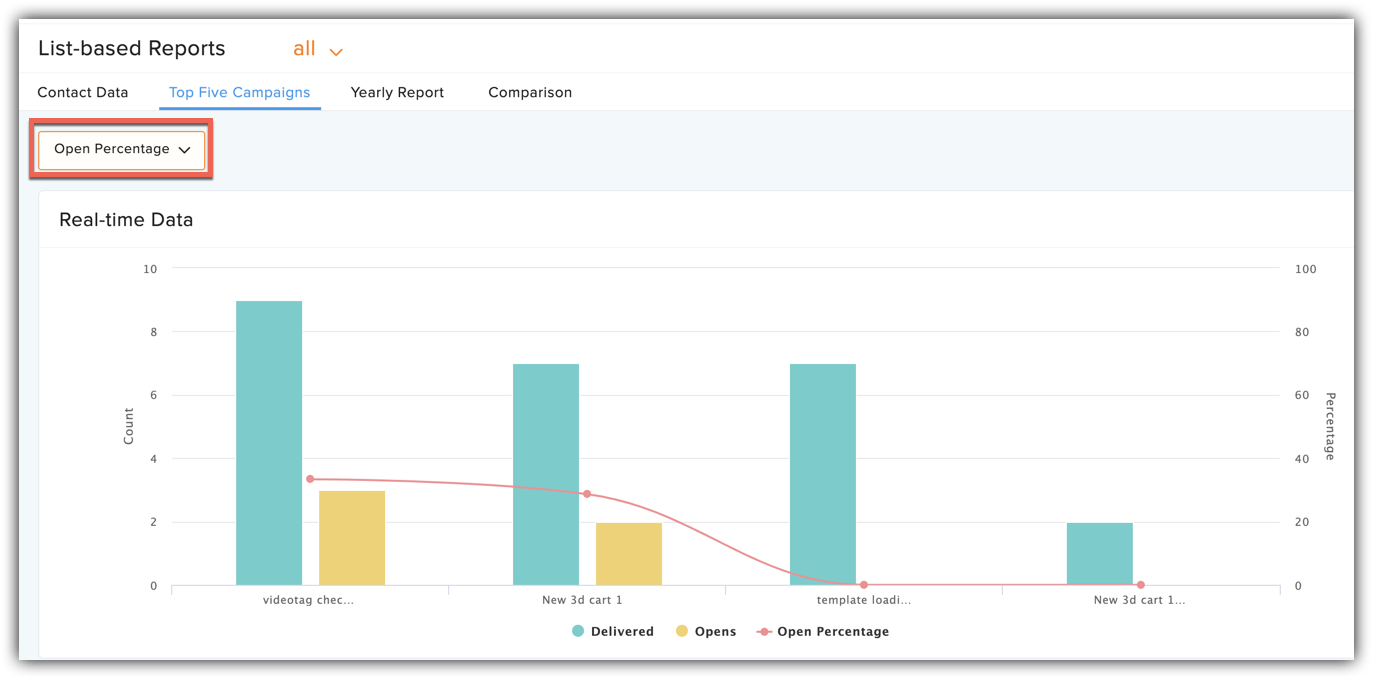
- Open Count - The graph displays those five campaigns that have highest number of opens.
Clicked Campaigns
This lists the first five campaigns with respect to two entities namely click percentage and click counts. Present in the graph are information on the following elements.
Open - Total number of times your campaign was opened.
Click - Total number of times links attached in the campaign were opened.
Click percentage - Open rate of the links in percentage scale.
Entities:
- Click Percentage - The graph displays the top five opened campaigns based on click percentage of the URLs attached.
- Click Count - The graph displays those five campaigns that have highest number of URL clicks.
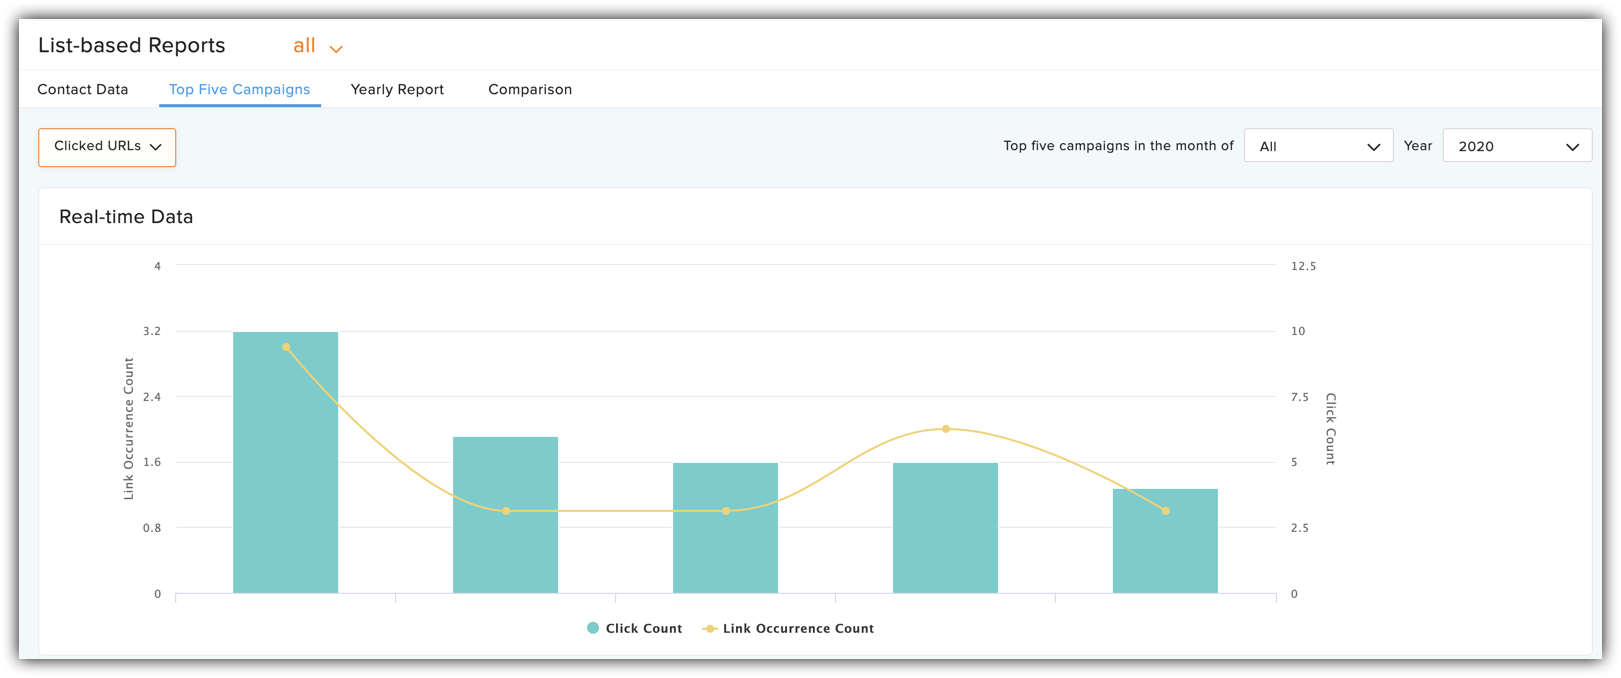
Clicked URLs
This shows those five links that received the highest number of visits. It gives data on the following elements.
Clicks - Total number of times the respective link was opened.
Link occurence count - Total number of times the respective link has occurred in the sent campaigns.
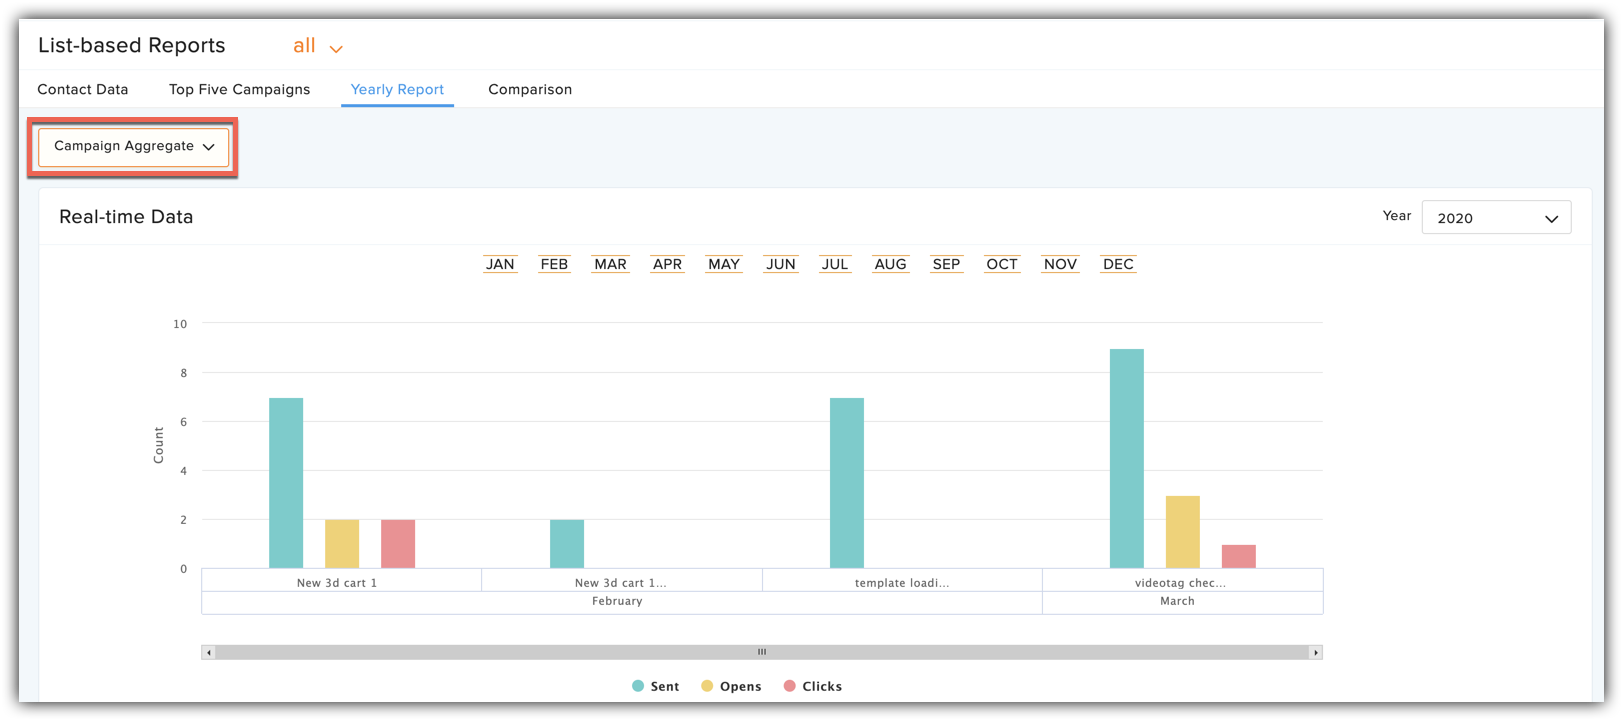
Yearly Report
In yearly stats, we show the performance of campaigns sent to the mailing list throughout a year.
- Click the Yearly Report tab.
Data for a particular year is represented in two ways:
Monthly aggregate
This report shows data on the campaign response based on months for the whole year you have selected. To view reports for a particular year, select year from the dropdown option present in the right corner of the graph.
Campaign Aggregate
This report shows campaign-wise data for every month of the selected year. To view reports of a particular year, select year from the dropdown option present in the right corner of the graph. If you want to view data for specific months, you have the option to deselect the remaining months as shown in the image.
Comparison Report
You can compare your campaigns' performance in two ways:
Yearly
You can see how your campaigns have performed over the years through Yearly Comparison. Click Change Comparison and select Yearly to choose for which years you want to make the comparison. Click the Compare button to see the results.
Quarterly
You can view your campaigns' performance over years by dividing the years into four quarters. Click Change Comparison and select Quarterly to select the start and end year for the comparison. Select the month from which you want a quarter to begin. Click the Compare button to see the results. You can only compare the quarterly reports of five consecutive years.


